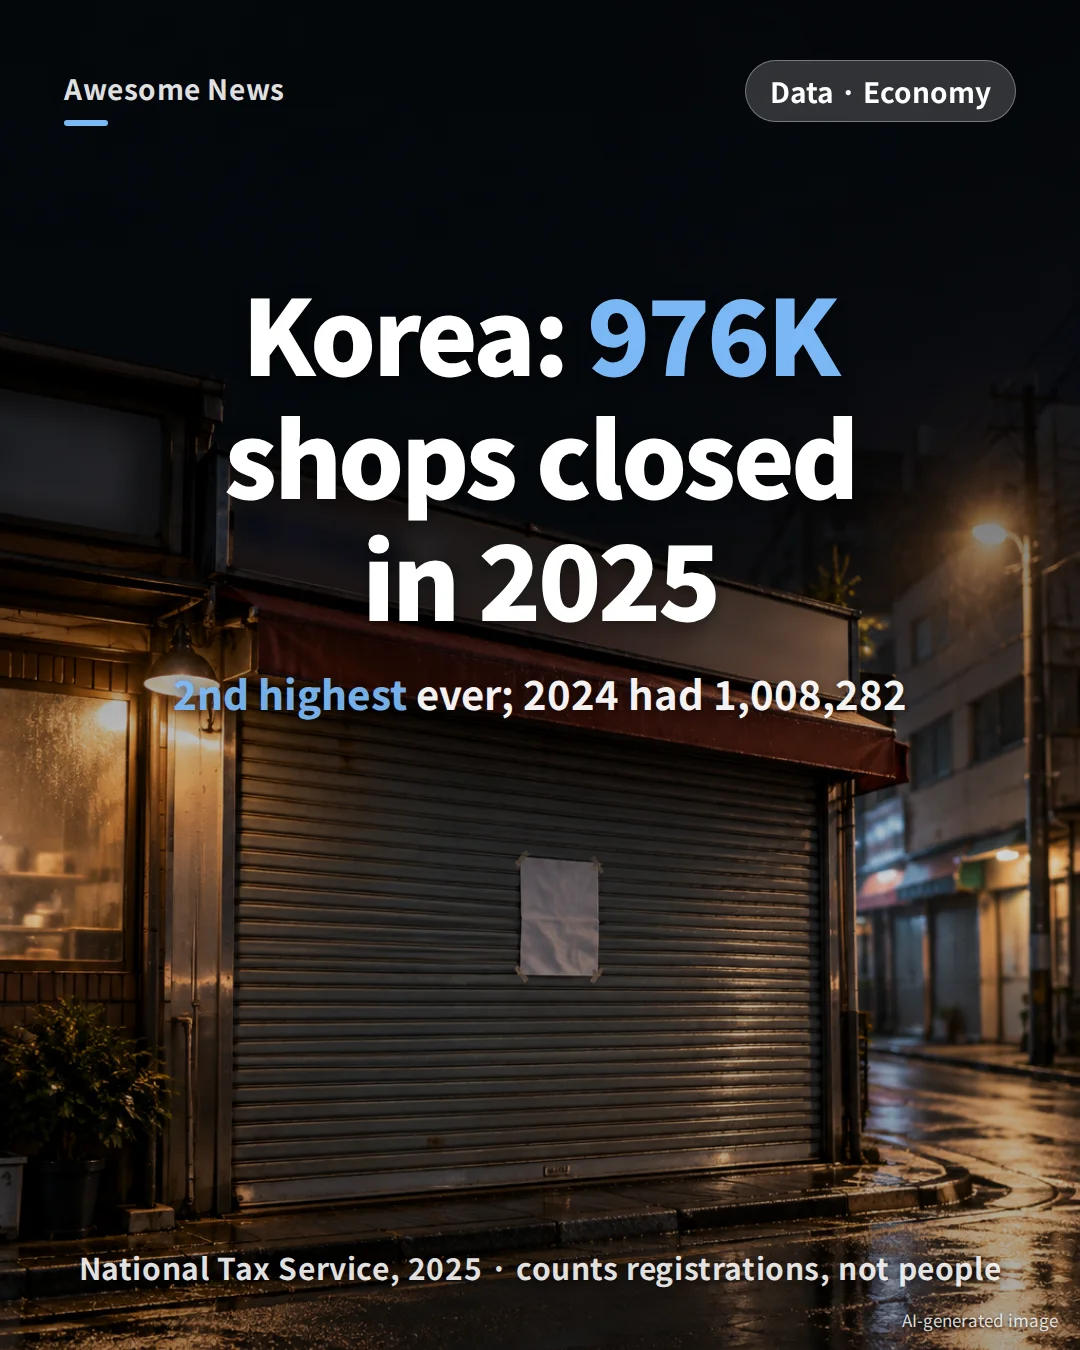
In 2025, 975,681 businesses in South Korea closed their doors, according to the National Tax Service — the second-highest annual total since the agency began tracking closures. The only higher year was 2024, with 1,008,282. For three years running, roughly a million registered businesses have shut down each year. This piece unpacks what that figure actually means: the 25-year trend, closure rates by sector, why owners say they quit, and how much debt they leave with. It also flags three common misreadings — including the claim that South Korea’s closure rate is at a record high (it isn’t).
Key numbers at a glance
- 976,000 business closures in 2025 (second-highest ever); 2024 holds the record at 1,008,282
- Closure rate = closures ÷ (active year-end + closures) = 8.64% — lower than the 13–18% seen in the 2000s
- New business openings have fallen for five straight years: from a 1.519 million peak in 2020 to 1.168 million in 2025
- Highest sector closure rates: retail 15.40%, food & beverage 15.14% (overall 8.64%)
- In a survey of 1,500 owners who closed, 68.5% carried debt, averaging 85.3 million won

A 25-year view: closures have stepped up a level
Pull the National Tax Service’s registered-business series (e-National Indicators 2825) back to 2001 and the shape is clear. Between 2010 and 2022, annual closures swung in a band of roughly 790,000 to 920,000. Then they jumped to 986,000 in 2023 and have stayed near a million since. The 2025 figure is 3.2% below 2024 but still the second-highest on record.
Openings have moved the other way. New business registrations peaked at 1.519 million in 2020, during the pandemic, and have fallen each year since — down to 1.168 million in 2025. Plotted together, the two lines are converging.
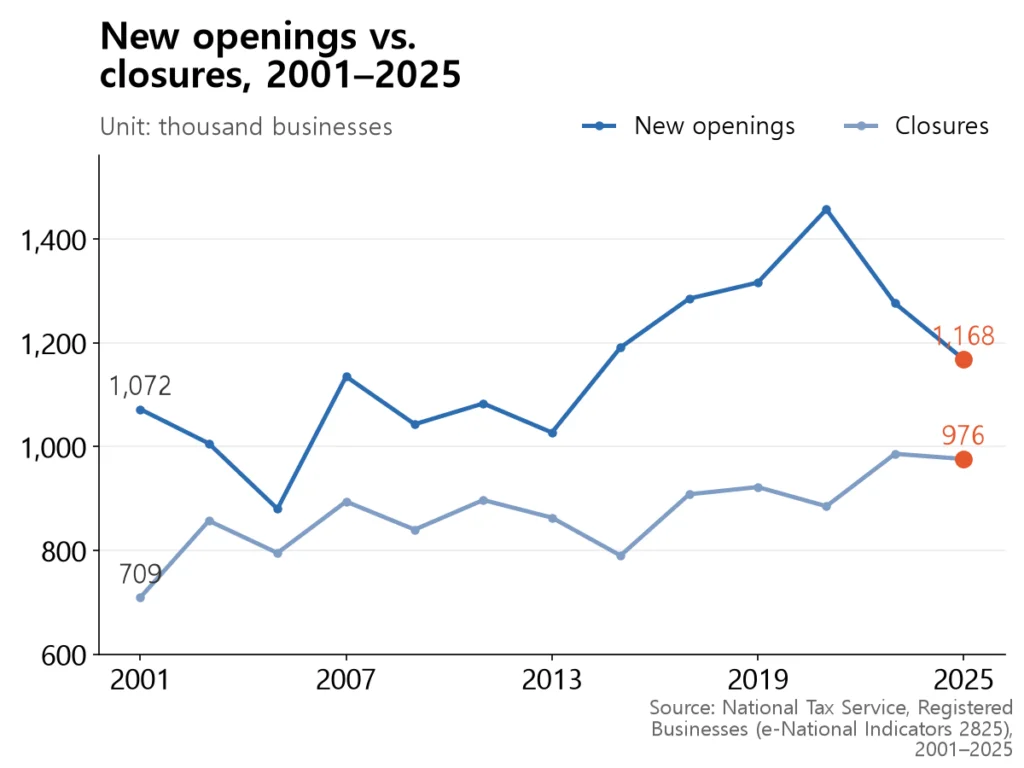
The ratio of closures per 100 openings has risen from 59 in 2020 to 84 in 2025 (calculated). That sounds dramatic, but it is close to 2005 (90) and 2012 (84), so calling it a historic gap would overstate the case. Two caveats also apply: the pandemic-era surge in openings makes 2020 a misleading baseline, and the definition of the denominator changed in 2006 (from VAT filers to year-end active businesses), so the series is not perfectly continuous.
By sector: retail and restaurants lead
The Ministry of SMEs and Startups published its analysis of the National Tax Service data on June 30, 2026. In 2025, closure rates were highest in retail (15.40%) and food & beverage (15.14%) — close to double the economy-wide 8.64%.
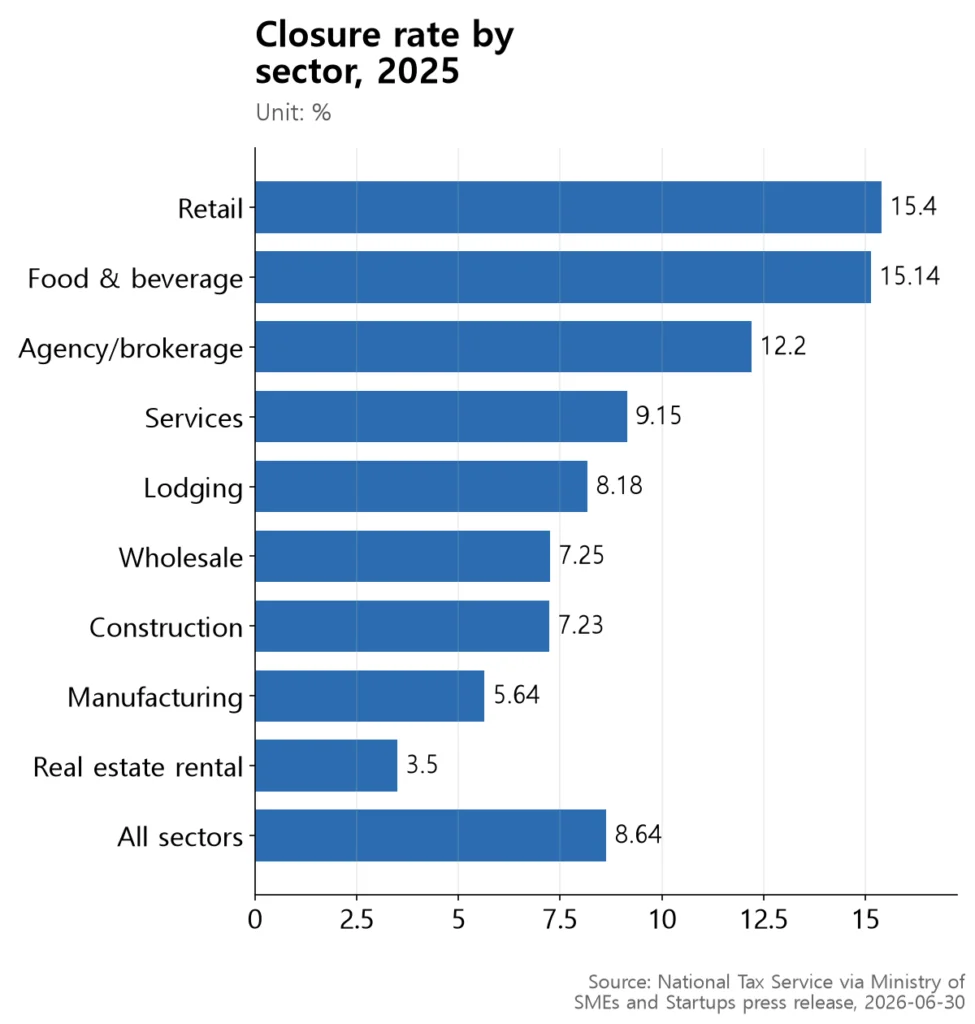
One caveat the ministry flagged itself: the retail figure includes online sellers (mail-order businesses), which register and deregister with almost no fixed-cost barriers. Looked at alone, online retail had an 18.3% closure rate. Reading the headline as “15% of neighborhood shops closed” overstates what the data shows.
Food & beverage closures have actually fallen three years in a row: 158,000 → 153,000 → 143,000. Active restaurants have shrunk too, from 820,000 to 799,000. In other words, fewer restaurants are closing — but fewer are opening as well.
Why they close: weak sales
The tax agency classifies closure reasons into four buckets (business downturn, other, transfer, miscellaneous). The share for “business downturn” has risen three years in a row: 48.9% in 2023 → 50.2% in 2024 → 50.4% in 2025. Among the six main small-business sectors (manufacturing, wholesale, retail, food, lodging, services) it is 55.7%; in retail alone, 60.3%.
A separate ministry survey of 1,500 owners who closed in the past year (fieldwork May 2026) tells a similar story. The top reason given was falling profits / weak sales — 70.9%. Asked (multiple answers allowed) why sales fell, respondents pointed to:
| Why sales fell (multiple answers) | All (%) | Lodging & food (%) |
|---|---|---|
| Weak domestic demand, fewer customers | 62.5 | 54.8 |
| Rising raw material costs | 29.4 | 39.9 |
| Rising labor costs | 28.8 | 35.6 |
| Rent and fixed costs | 24.9 | 24.8 |
| Over-competition | 15.0 | 10.3 |
64.4% of surveyed owners said they only decided to close after revenue had already dropped by 40% or more from normal levels — a sign that most hold on for a long time before giving up. One note on the tax data: nearly 44.6% (436,000 closures) fall into the vague “other” bucket, so “50% closed due to downturn” also means roughly half of all closures are not clearly classified.
What’s left after the shutter: 85 million won in debt

The same survey found that 68.5% of owners carried debt when they decided to close, averaging 85,305,000 won (about 85.3 million won). The older the owner, the larger the debt.
| Age group | Average debt at closure (million won) |
|---|---|
| Under 30 | 35.67 |
| 30s | 72.95 |
| 40s | 76.73 |
| 50s | 84.24 |
| 60+ | 98.97 |
Closing itself costs money. Owners spent an average of 12.86 million won winding down — 5.59 million for clearing the premises, 2.21 million settling supplier credit, 2.05 million in severance pay, 1.13 million in unpaid rent, and so on. “Key money” — the up-front, non-refundable payment a tenant typically makes to the previous occupant in Korea — averaged 13.37 million won going in, but only 4.22 million recovered on the way out. That is a 31.5% recovery rate.
The single biggest difficulty at the moment of closing, respondents said, was loan repayment (45.5%). The top difficulty after closing was covering household living expenses (40.5%). Shutting the business is not the end of the stress — it is the start of years spent paying off what remains.
2026 so far: signals point in different directions

Early-2026 data give mixed signals. According to press reports citing the National Tax Service’s monthly regional indicators (raw file not seen), 332,341 businesses closed from January to May 2026, down 11.1% from the 373,676 in the same period a year earlier. That works out to roughly 2,200 closures a day.
But payouts from Noran Umbrella, a mutual-aid savings scheme that small-business owners withdraw from when they close, are rising. Press reports citing the Korea Federation of SMEs put first-half 2026 payouts at 966.7 billion won (62,868 claims) — up 15.8% year-on-year.
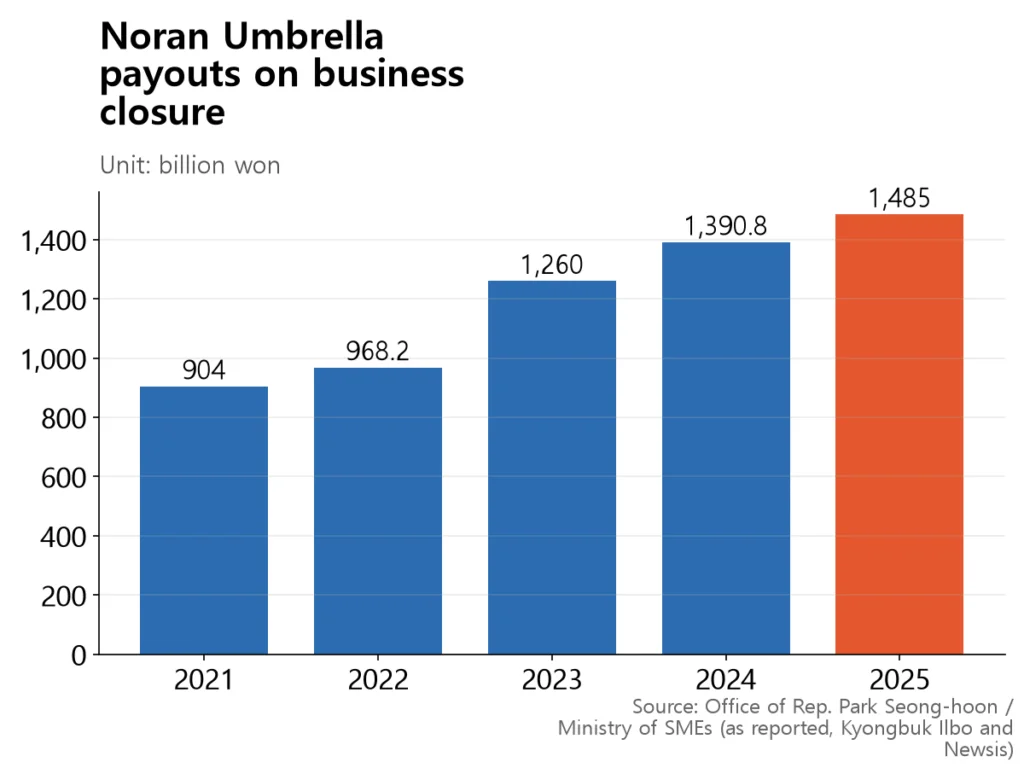
Bank of Korea data cited in press reports (primary file not seen) show the delinquency rate on loans to vulnerable self-employed borrowers at 12.71% at the end of Q2 2026, up again this year. Registered closures are falling, but lagging stress indicators — mutual-aid payouts, loan delinquencies — are rising. On the available evidence, calling 2026 a record-closure year is premature.
Three common misreadings
1. “Closure rate at an all-time high” — wrong
The number of closures hit a record in 2024, but the rate is actually lower than in the 2000s (13–18%) or the 2010s (10–13%). It was 16.05% in 2001, 13.31% in 2010, 10.28% in 2019 and 8.64% in 2025.
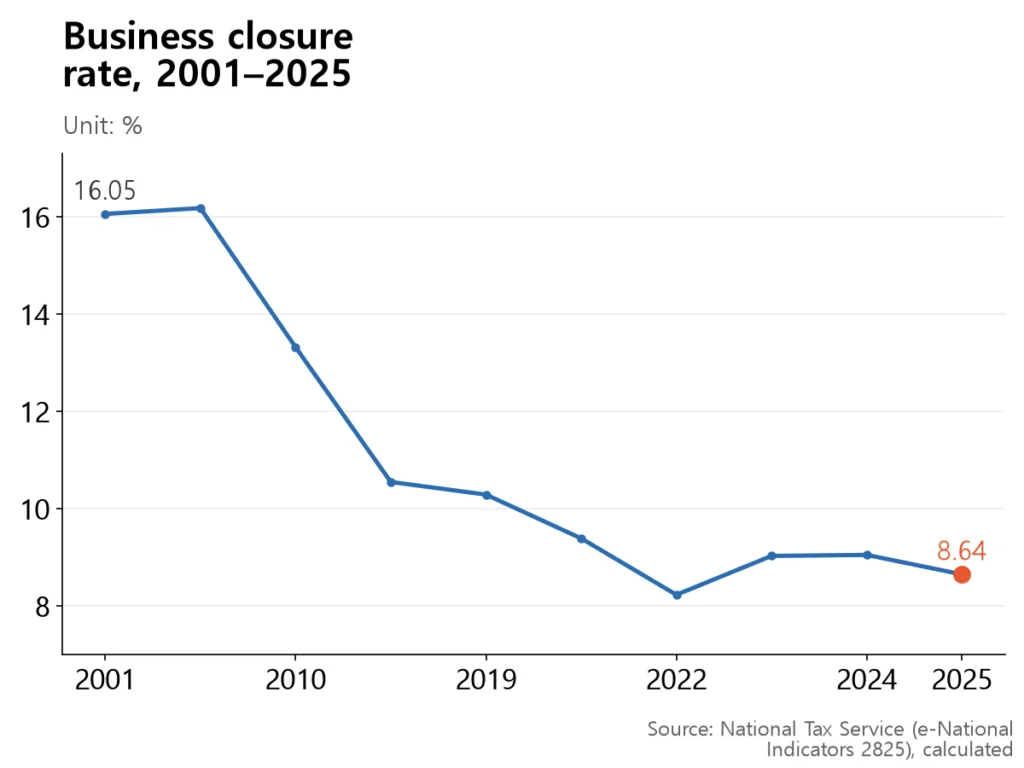
Why does the rate look so low? The denominator — registered businesses — has ballooned. Active businesses rose from 4.89 million in 2006 to 10.32 million in 2025, more than doubling. That pool includes 2.42 million real-estate rental operators and 680,000 online sellers, categories that behave very differently from a corner shop. So the long-run rate comparison is not perfectly apples-to-apples.
2. “A million self-employed Koreans went bust” — also wrong
976,000 is a count of business registrations closed, not people. The ministry’s own press release warned against conflating the two. Statistics Korea’s Economically Active Population Survey counts the self-employed as people, and that figure averaged 5.62 million in 2025 — barely changed from the 6.21 million recorded in 2002.
| Year | Self-employed (millions of people) | Share of all workers |
|---|---|---|
| 2002 | 6.212 | 27.9% |
| 2010 | 5.643 | 23.5% |
| 2015 | 5.622 | 21.5% |
| 2020 | 5.531 | 20.6% |
| 2023 | 5.689 | 20.0% |
| 2024 | 5.657 | 19.8% |
| 2025 | 5.620 | 19.5% |
If the headcount is stable while registrations have doubled, it is likely because one person can register multiple businesses — and because real-estate rental and online-seller registrations churn more easily. “976,000 closures = 976,000 people going out of business” inflates the picture.
3. Remember what the survey sample is
Figures used in this article such as 85.3 million won in average debt and 70.9% citing weak sales all come from the ministry’s survey of 1,500 small-business owners who closed. Respondents were drawn from users of government support programs — “Hope Return Package” transitions services, Noran Umbrella withdrawals, and regional credit guarantees. People in enough trouble to use government aid are over-represented, so the sample does not represent all closed businesses. Headlines along the lines of “7 in 10 closed-business owners…” push past what the data can tell us.
Summary — how to read the number
The through-line: closures have stepped up to roughly a million a year for three years running, while new openings have fallen for five. Over half of closures are classified as weak sales. In a survey of owners who closed, debt at the point of closure averaged 85.3 million won, with another 12.9 million spent to wind the business down. But the closure rate is still lower than in the 2000s; the registered-business count is not the same as the number of self-employed people; and the survey sample skews toward owners who sought government support. Those caveats are the layers beneath the simple headline that 2025 was Korea’s second-worst year on record for business closures.

Awesome News on Instagram @awesome_news_kr
This article is the research behind our Korean-language card news. Every morning we turn Korean data and official sources into short visual stories. See it on Instagram →
Sources
- Ministry of SMEs and Startups — A data-driven look at closed businesses: scale, causes and conditions (with attachments 1 and 2) (Korean) (2026-06-30)
- National Tax Service / e-National Indicators — Registered Businesses, annual (indicator 2825) (Korean) (2001–2025)
- Statistics Korea / e-National Indicators — Self-Employed Workers (indicator 2779, Economically Active Population Survey) (Korean) (1996–2025)
- Financial News (via Newsis) — H1 payouts hit 966.7 billion won — will 2026 set a new closure record? (Korean) (2026-08-09)
- Kyongbuk Ilbo — Noran Umbrella closure payouts up 64% in five years (Korean) (2026-02-22)
- Metro Seoul — Noran Umbrella closure payouts hit record 1,485 billion won in 2025 (Korean) (2026-09-25)
- Metro Seoul / citing Bank of Korea — Financial Stability Report: self-employed loans at 1,095.5 trillion won; vulnerable-borrower delinquency 12.68% (Korean) (2026-06-24)
- Herald Business / citing Bank of Korea Financial Stability Report — Vulnerable self-employed delinquency hits 12.71% amid rising debt burden (Korean) (2026-09-22)
- Seoul Economic Daily — Small-business closure rate 11%: 7 in 10 cite weak sales (Korean) (2026-06-30)
- Sisa Journal — 970,000 businesses closed last year; 7 in 10 owners carried 85 million won in debt (Korean) (2026-06-30)
- Korea Enterprises Federation (via KDI Economic Information Center) — Characteristics and implications of recent business closures (Korean) (2025-01-06)
📊 Download the data
Every number in this article’s 7 charts and tables, in one CSV file (opens in Excel or Google Sheets). When you cite it, please name the original source and link to this page.
Download CSV