
South Korea’s wine imports more than doubled during the pandemic, peaked in 2022, then fell for three straight years to $434 million in 2025 — 25% below the peak. Early 2026 looks different: January–August imports came in just +0.2% above the same period in 2025. The slide appears to have stopped.
This piece uses Korea Customs Service trade statistics (HS 2204 ‘wine of fresh grapes,’ through August 2026) to track value, volume, and dollars-per-liter, country-by-country shifts, and the wider picture for whiskey, sake, and overall alcohol shipments. The single-line conclusion: what shrank was not wine, but expensive wine.
Key numbers at a glance
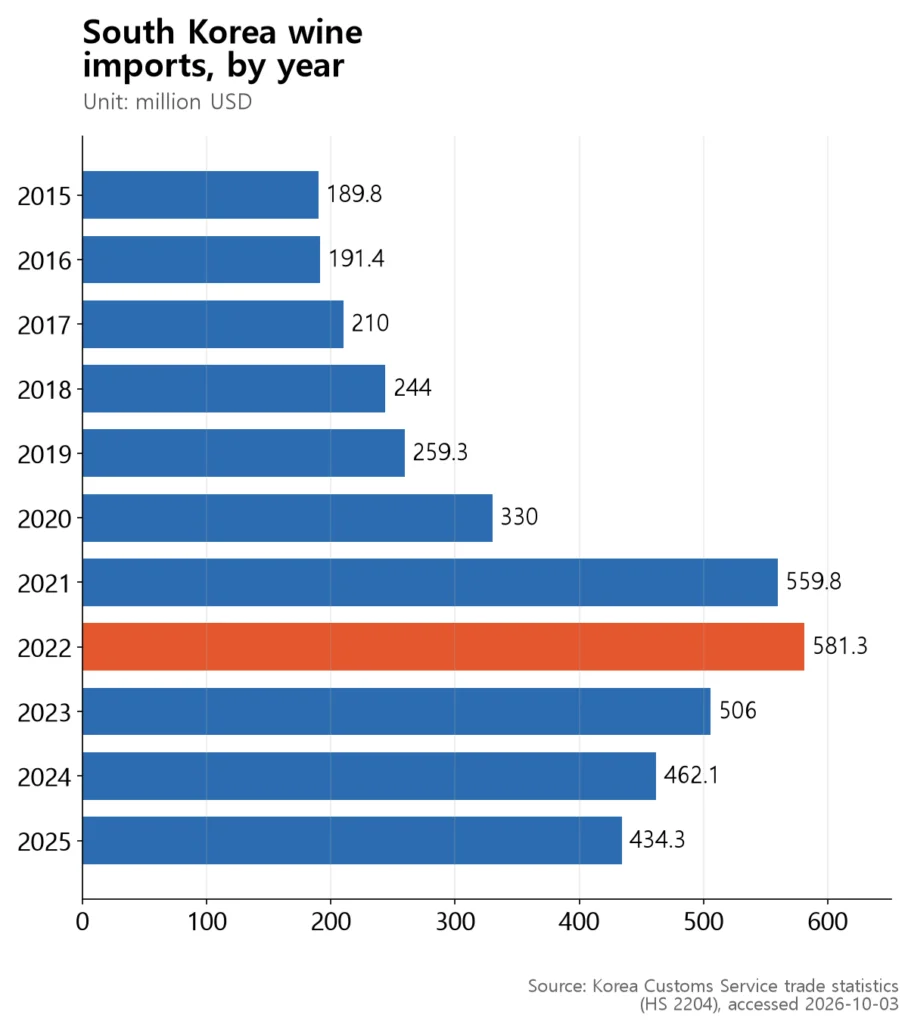
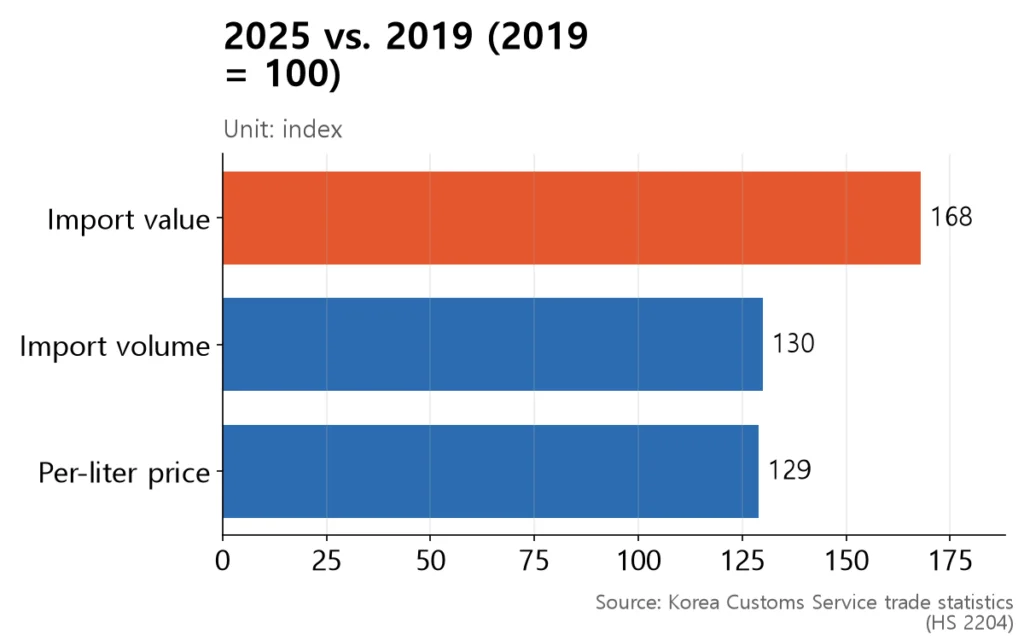
- Import value: $259.3M (2019) → $581.3M (2022 peak) → $434.3M (2025) — −25% from peak, still 1.7× the pre-COVID level
- Jan–Aug 2026: $280.6M vs. $279.9M a year earlier — +0.2%, the decline has stopped
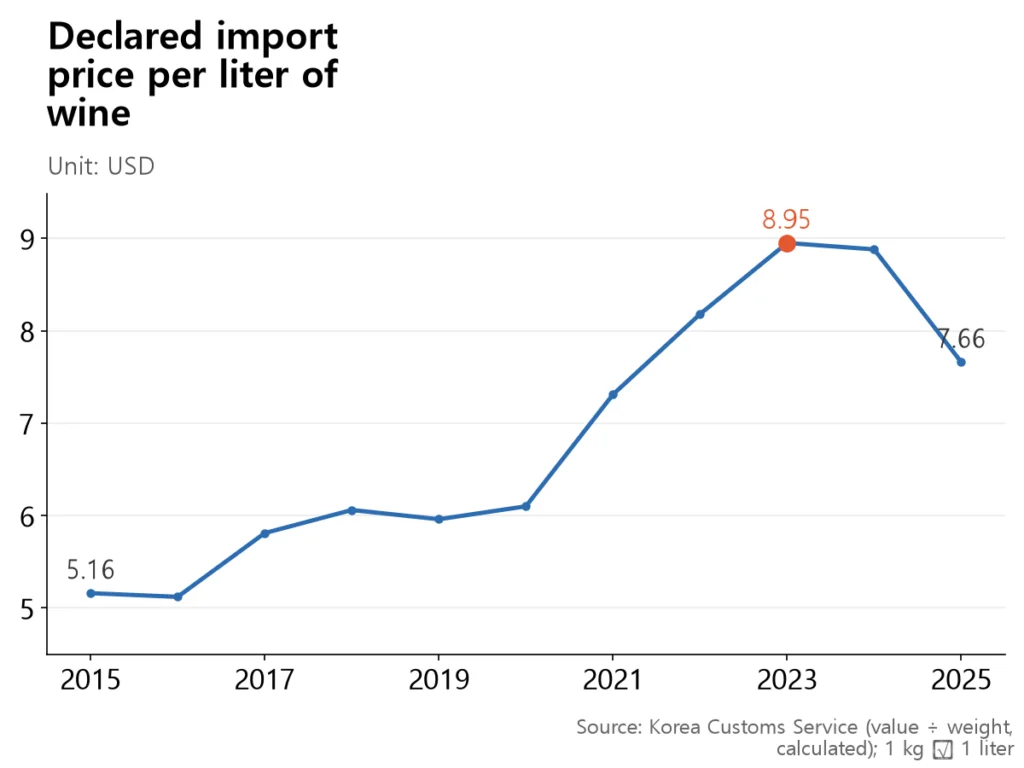
- Dollars per liter (declared import price, not retail): $5.96 (2019) → $8.95 (2023 peak) → $7.66 (2025). In 2025 Korea spent 6% less but imported 9% more volume — half of the extra came in containers larger than 2 liters (bulk wine)
- By country (2022 → 2025, value): US −39%, Chile −34%, Italy −32%, France −23%, New Zealand +148% (and 9.6× the 2019 level)
- Whiskey fell too: volume down −26% from its 2023 peak, and −22% year-on-year in Jan–Aug 2026. The only clearly rising category is Japanese fermented beverages (sake and the like)
1. The COVID boom: imports 2.2× in three years
Imports of wine (HS 2204) jumped from $259.3M in 2019 to $330.0M in 2020, $559.8M in 2021, and $581.3M in 2022 — 2.2× in three years.
The three years that followed were a steady decline: $506.0M in 2023, $462.1M in 2024, and $434.3M in 2025, or −25% from the peak. Even so, the 2025 figure is still 1.7× the 2019 level.
The early-2026 flat line is the more telling number. Jan–Aug 2026 imports of $280.6M are essentially unchanged from the same months of 2025 ($279.9M). For context, the International Organisation of Vine and Wine (OIV) reports that global wine consumption in 2025 fell to 208 million hL — the lowest since 1957 (as reported by TASS, 2026-05-12). Against that backdrop, the Korean market looks like it has found a floor rather than kept falling.
2. What shrank was ‘expensive wine,’ not wine

Divide import value by import weight and you get the declared price per kilogram (which is close to per liter). This is the customs value, not the retail price. It rose by half during the boom — $5.96 (2019) → $7.31 (2021) → $8.18 (2022) → $8.95 (2023) — then fell to $8.88 in 2024 and $7.66 in 2025. Translation: during the boom Korea was importing pricier bottles; it is now importing cheaper ones.
The clearest flip is 2025: import value fell 6% but import volume rose 9% (from 52,036 to 56,664 tonnes). Of the extra 4,628 tonnes, roughly half — about 2,367 tonnes — came in containers larger than 2 liters (bulk wine, HS 220429). Bulk-wine imports were just $4.2M in 2019; in 2025 they reached $20.3M. In Jan–Aug 2026 alone, bulk volume already hit 5,530 tonnes, surpassing the full 2025 figure of 5,403 tonnes.
So the common line that ‘the wine market shrank again last year’ has it backwards. Koreans spent less on wine, but imported more of it.
3. France and the US are down; only New Zealand grew

The country-level picture is sharper. Comparing 2022 and 2025, every major supplier dropped by double digits — except New Zealand, which more than doubled.
| Country | Value 2022 → 2025 (million USD) | Change | Price per kg, 2025 |
|---|---|---|---|
| France | 203 → 157 | −23% | $18.1 |
| United States | 103 → 63 | −39% | $14.6 |
| Italy | 86 → 59 | −32% | $7.7 |
| Chile | 67 → 44 | −34% | $3.9 |
| Spain | 36 → 27 | −26% | $2.7 |
| New Zealand | 16 → 39 | +148% | $6.0 |
New Zealand went from $4.0M in 2019 to $38.5M in 2025 — 9.6× in six years. Its share of imports by value rose from 1.5% to 8.9%, putting it inside the top five. In Jan–Aug 2026 it held 8.0% by value and 10.2% by volume.
By volume, there has been another handover. In 2019 Chile led import volumes (26.3%). In Jan–Aug 2026 Spain is the volume leader at 24.2% — and the cheapest source on the list, at $2.3 per kg. Pricey French and American wine lost value share; cheap bulk and newer suppliers like New Zealand took the slack.
For historical context: after the Korea–Chile free trade agreement entered into force in 2004, Chilean wine imports jumped from $3.0M (2003) to $8.0M (2004) and $11.9M (2005), and Chile held the volume lead through the 2010s. But Chile’s value share in 2025 was 10.1%, down from 18.8% in 2019 — a volume-only presence now.
4. Not a switch to whiskey — Koreans are simply drinking less

The ‘they switched to whiskey’ story is not in the data. Whiskey (HS 220830) imports peaked at 30,586 tonnes in 2023 and fell to 22,582 tonnes in 2025 (−26%). Jan–Aug 2026 (12,205 t) is −22% below the same period of 2025 (15,663 t) — a steeper slide than wine (−2.7%).
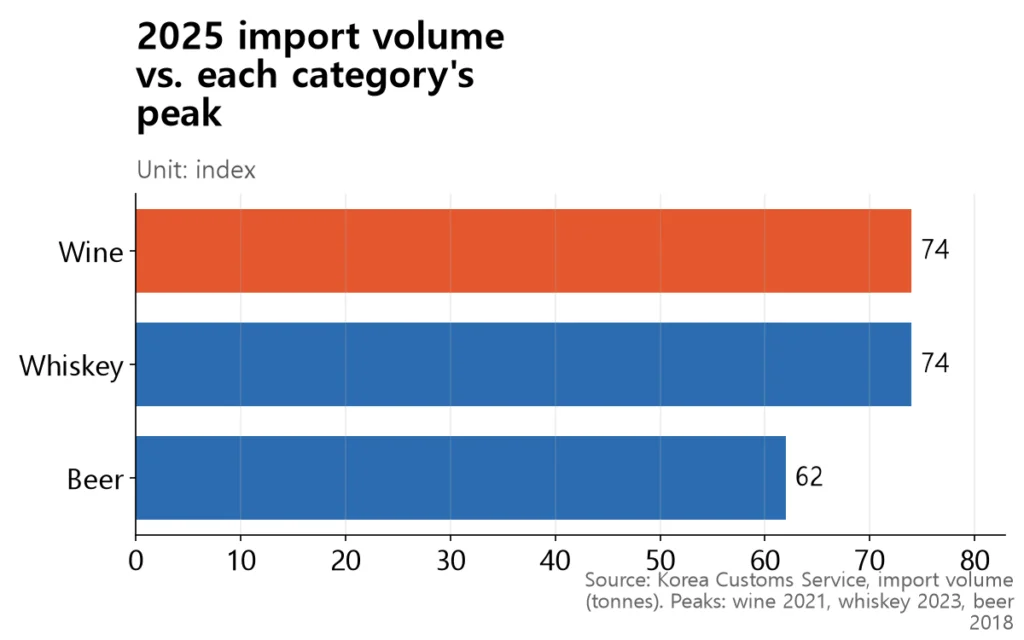
The one clearly rising category is Japanese fermented beverages (HS 2206, which includes sake), where import value rose from $14.7M in 2019 to $34.8M in 2025 — 2.4×. Note that HS 2206 also covers cider, perry and other fermented drinks, so this is not sake alone.
Domestic data point in the same direction. Total alcohol shipments (National Tax Service, including imports) fell from 4.074 million kL in 2015 to 3.516 million kL in 2024 — about −14% in a decade (calculated). WHO’s estimate of pure-alcohol consumption per person aged 15+ in Korea has drifted down from 10.34 L in 2000 to 8.28 L in 2019 and 7.59 L in 2024.
Yet the share of adults who drink at least monthly, from the Korea Disease Control and Prevention Agency’s health survey, barely moved: 60.8% in 2019 → 59.7% in 2024 (age-standardised). The share of people who drink held steady while the total amount fell.
5. Common misconceptions
- ‘The wine market halved’ is overstated. The dollar value is −25% from peak. In won, converted at Bank of Korea annual averages, imports went from roughly 751 billion won in 2022 to 617.6 billion won in 2025 — −18% (calculated). A weaker won softened the drop in local-currency terms, and the 2025 total is still roughly double 2019’s 302.2 billion won.
- ‘Volume also fell in 2025’ is wrong. Value was −6.0%; volume was +8.9%. More than half of the extra volume came in bulk containers larger than 2 liters.
- Why different outlets quote different 2025 totals. The Wine21 figure of $409M covers only sparkling (HS 220410) and bottled wine ≤2 L (220421). The Korea Customs Service total for HS 2204 is $434.3M. Both are correct — different scopes.
- October 14 ‘Wine Day’ is not an official holiday. It does not appear on the government’s list under the ‘Regulations on Commemorative Days’ (in force 2026-01-02), and the story that it originated from a feast day of Dionysus has no verifiable source. It fits the pattern of monthly 14th-of-the-month marketing days in Korea.
6. How to read these numbers
- The per-liter figure is customs value, not retail. It is total import value divided by weight. It reflects product mix, exchange rates and freight — not the price of a specific bottle on a shelf.
- Liters and kilograms are treated as 1:1. Korea’s UN Comtrade reporting data suggests the gap is under 1%.
- Japanese ‘sake’ here is approximated by HS 2206 (origin: Japan) in total. That heading also contains cider, perry and other fermented drinks, so it overstates sake alone.
- Won figures are reference values multiplied by Bank of Korea annual-average exchange rates (1,165 won/USD in 2019, 1,292 in 2022, 1,422 in 2025).
- The global wine consumption figure (OIV, lowest since 1957) is quoted from press reports; we could not access the original OIV report.
Summary — The froth is gone, but wine is still on the table

The 2020–2022 wine boom has clearly ended. But in 2025 import value is still 1.7× the 2019 level, volume 1.3× (calculated), and the per-liter price 1.3× (calculated). The flat Jan–Aug 2026 reading (+0.2%) suggests the market is not returning to its pre-COVID size so much as settling in at a new, wider base.
What dropped was not wine itself but expensive wine. French, American and Italian imports fell sharply by value; New Zealand, Spain and 2-liter-plus bulk filled the space. Whiskey is falling faster than wine, and total alcohol shipments are down 14% in a decade. The share of people who drink has held steady while the total amount keeps falling.
October 14 isn’t an official holiday, but it is a fine excuse to look at the glass in front of you. The declared import price per liter is now below its 2023 peak.

Awesome News on Instagram @awesome_news_kr
This article is the research behind our Korean-language card news. Every morning we turn Korean data and official sources into short visual stories. See it on Instagram →
Sources
- Korea Customs Service — Trade statistics (wine HS 2204, whiskey 220830, beer 2203, HS 2206; through August 2026) (Korean) (accessed 2026-10-03)
- UN Statistics Division — UN Comtrade public API — Korea reported imports 2000–2025 (cross-check)
- National Tax Service of Korea — Alcohol shipment indicator (e-Narajipyo, indicator 2824) (Korean)
- Korea Disease Control and Prevention Agency — Monthly drinking rate (e-Narajipyo, indicator 2771, KNHANES) (Korean)
- Korea Disease Control and Prevention Agency — Public Health Weekly Report vol. 19 no. 12 — monthly binge-drinking rate (Korean)
- World Health Organization — Per-capita alcohol consumption (GHO SA_0000001400)
- Korea Law Information Center — Liquor Tax Act (in force 2025-01-01) (Korean)
- Korea Law Information Center — Regulations on Commemorative Days (in force 2026-01-02) (Korean)
- International Organisation of Vine and Wine (OIV); TASS press report — OIV ‘State of the World Wine Sector in 2025’ — global consumption 208 million hL (as reported by TASS) (2026-05)
- Datanews — 2025 alcohol shipments and imports report (Korean) (2026-09-17)
- Insight — 2025 wine imports and E-Mart wine sales (Korean) (2026-04-27)
- Hanguk Sisa Gyeongje — 2025 KNHANES drinking indicators press release (Korean) (2026-09-30)
- Wine21.com — Summary of the 2025 wine market (Korean)
- Seoul Shinmun — Report on the origins of Wine Day (Korean) (2017-10-14)
📊 Download the data
Every number in this article’s 5 charts and tables, in one CSV file (opens in Excel or Google Sheets). When you cite it, please name the original source and link to this page.
Download CSV