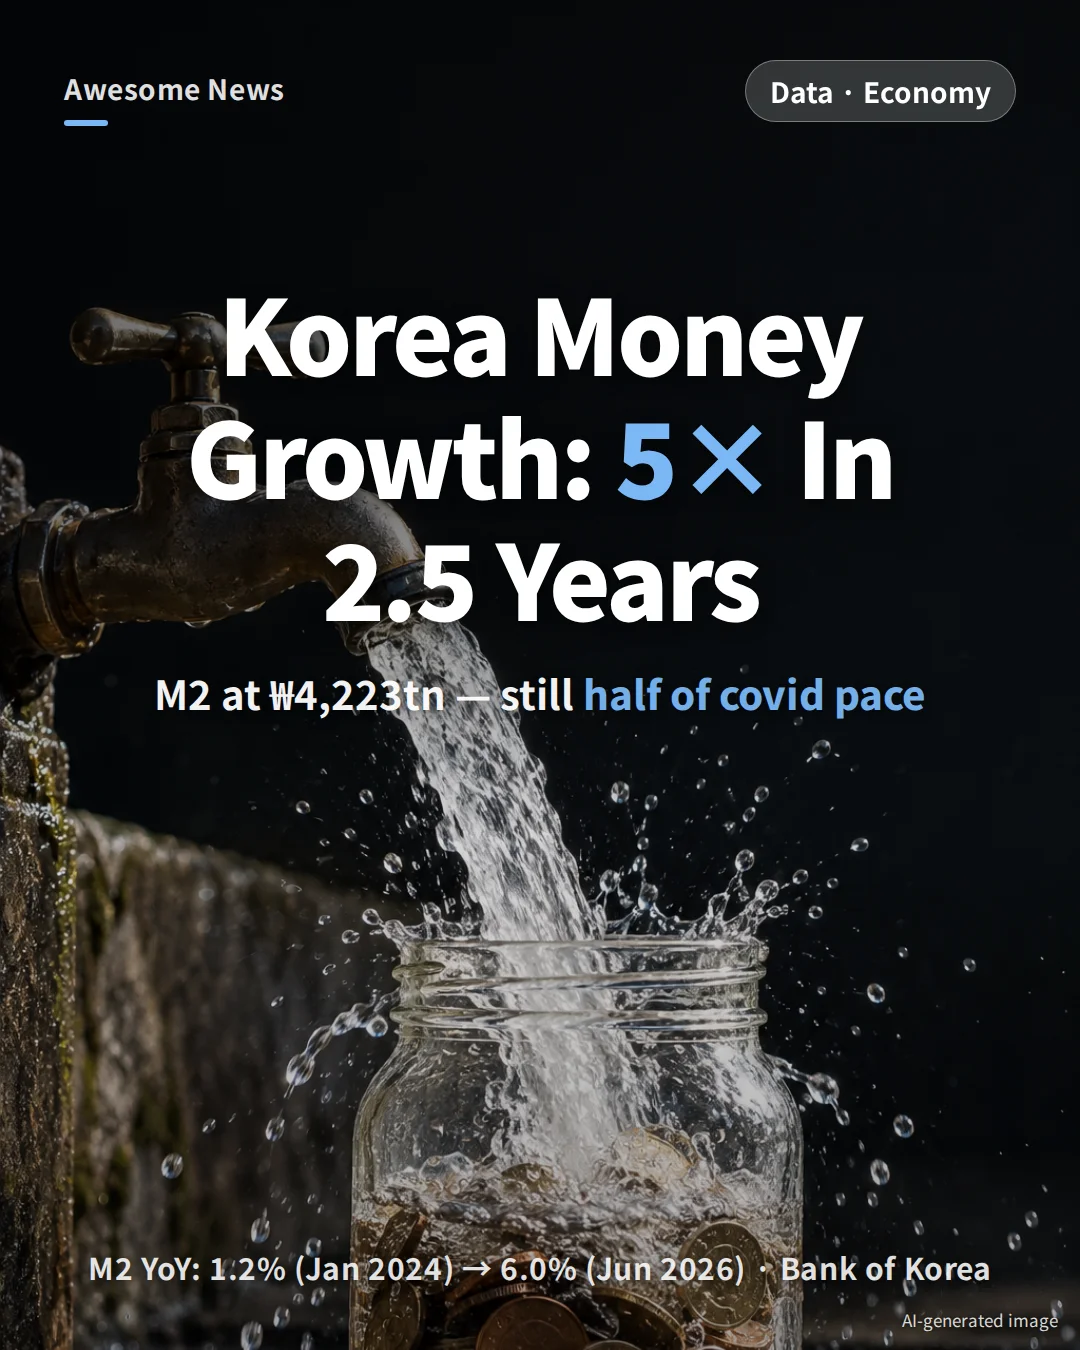
Money is flowing again. South Korea’s M2 — a broad measure of money in circulation — grew 6.0% year-on-year in June 2026, up from a trough of just 1.2% in January 2024. That is roughly a fivefold acceleration in two and a half years (July eased to 5.8%). The stock itself hit a record 4,223 trillion won. Yet today’s pace is still only half of the pandemic peak of 12.3% hit in December 2020, and below the pre-covid five-year average (7.0% in 2015–2019).
This piece unpacks the numbers behind that shift: Korea’s M2 stock and growth rate year by year, the post-covid swing in speed, how Korea compares with the US, the eurozone and Japan — and why a 2024 headline about M2 ‘crossing 4,000 trillion won’ does not line up with today’s figures.
Key numbers at a glance
- M2 stock: 4,223.4 trillion won (July 2026 monthly average) — a record on the Bank of Korea’s ECOS database
- Growth rate: 1.2% (Jan 2024) → 6.0% (Jun 2026) → 5.8% (Jul 2026) — about 5× in 2.5 years (calculated)
- Still half of the covid peak (12.3%) and below the pre-covid 5-year average (7.0%)
- Korea and the US are re-accelerating (US at 5.7%); eurozone 3.2%, Japan 2.0% remain subdued
- Cumulative M2 growth since Feb 2020 is +52.3% in Korea — almost identical to the +54.5% implied by pre-covid trend growth
Why watch the growth rate, not the stock

M2 adds to narrow money (cash and demand deposits, or M1) a wider set of near-cash instruments: time and savings deposits of under two years, money market funds, and other quickly convertible deposits. In Korean news coverage it is the standard headline gauge for ‘how much money is sloshing around’.
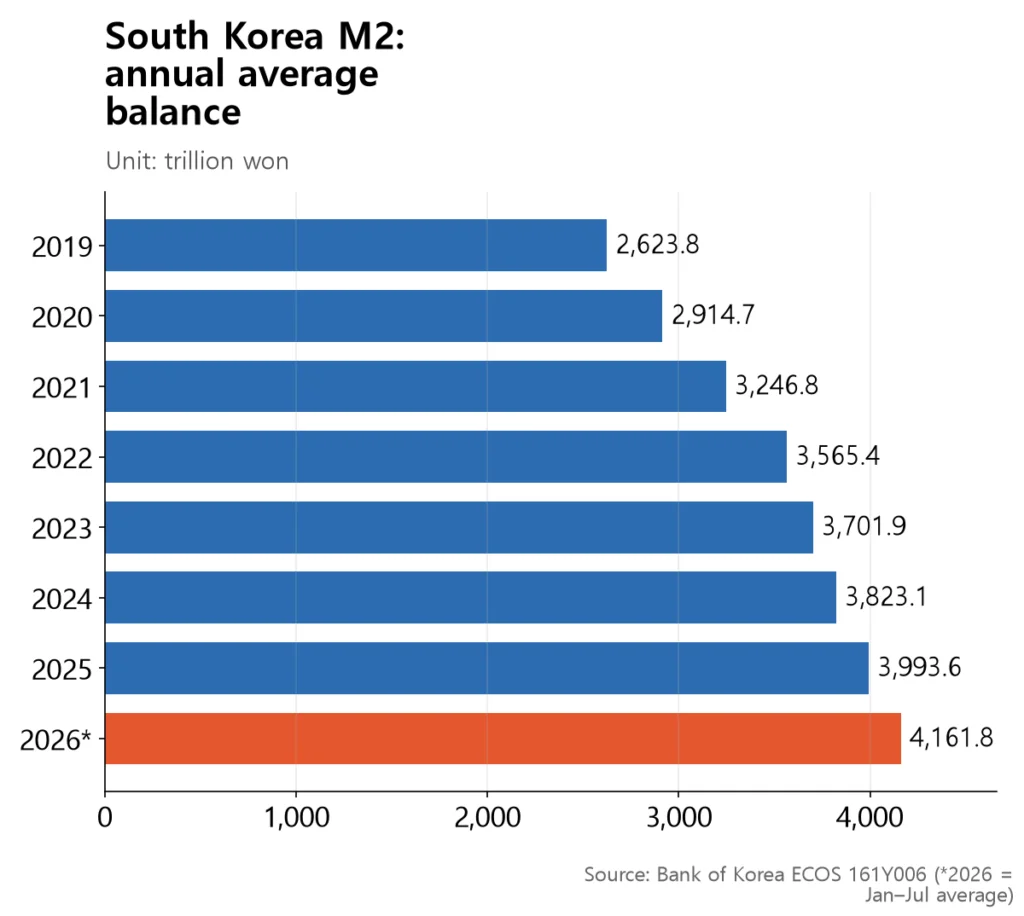
But the M2 stock sets records almost by definition — as the economy grows, so does the money that greases it. Korea’s average M2 balance climbed from 2,031.9 trillion won in 2015 to 3,993.6 trillion won in 2025. The question that matters is not the level, but how fast it is growing.
| Year | M2 avg balance (trillion won) | Growth (%) |
|---|---|---|
| 2015 | 2,031.9 | — |
| 2016 | 2,186.7 | — |
| 2017 | 2,336.4 | 6.8 |
| 2018 | 2,470.5 | 5.7 |
| 2019 | 2,623.8 | 6.2 |
| 2020 | 2,914.7 | 11.1 |
| 2021 | 3,246.8 | 11.4 |
| 2022 | 3,565.4 | 9.8 |
| 2023 | 3,701.9 | 3.8 |
| 2024 | 3,823.1 | 3.3 |
| 2025 | 3,993.6 | 4.5 |
| 2026 (Jan–Jul) | 4,161.8 | 5.5 |
A six-year swing: cool, then hot again

Measured by speed, the picture is very different. As the Bank of Korea and the government flooded markets with liquidity in 2020, year-on-year M2 growth jumped to 12.3% in December 2020 — nearly double the 7.0% average of 2015–2019.
Rate hikes then cooled things sharply. Growth fell to 1.8% in December 2023 and bottomed at 1.2% in January 2024. From there it turned again — 4.2% through 2024, 4.7% in 2025, and 6.0% by June 2026. The ‘five times in two and a half years’ figure refers to that climb from the 1.2% trough to the 6.0% peak (calculated).
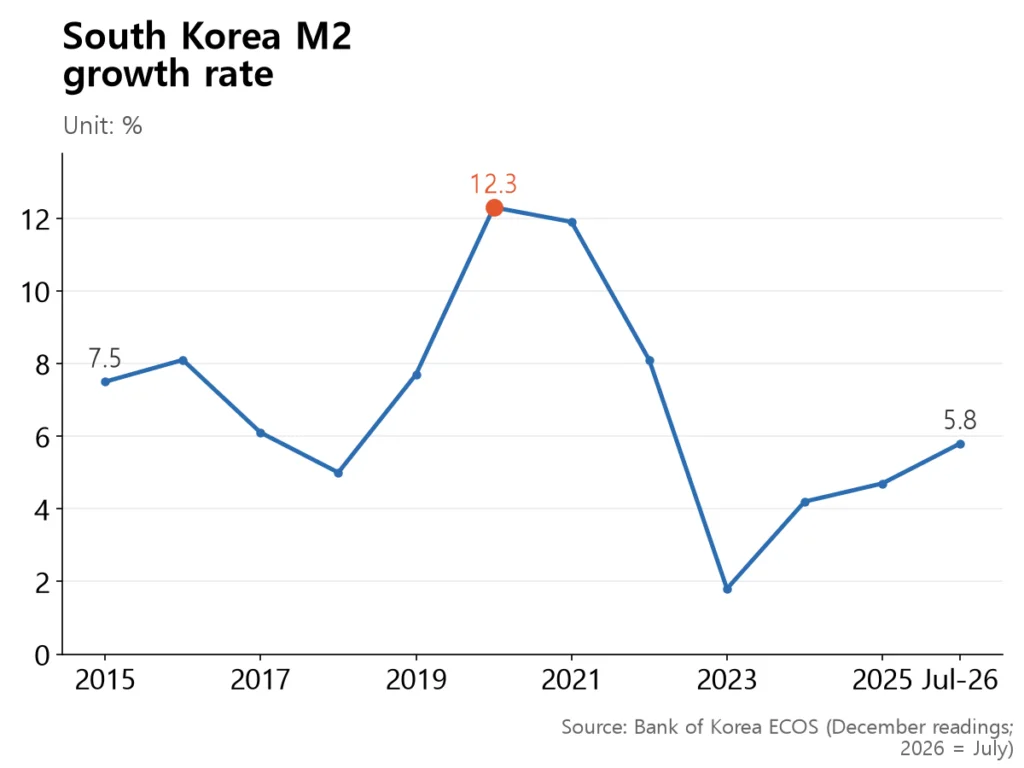
The last six years have traced a sharp pendulum: boom → bust → re-acceleration. But the current 6% remains well below the covid peak and still a touch under the pre-pandemic normal of 7%.
The US is also re-accelerating — four-country comparison

US M2 grew 5.7% year-on-year in August 2026, up from 4.1% at the start of the year — a 1.6-percentage-point acceleration in six months (calculated). That is a dramatic turnaround for an aggregate that shrank for 15 straight months from December 2022 through February 2024, bottoming at −4.6% in April 2023. US M2 is now running slightly above its own pre-covid five-year average of 5.4%.
The eurozone (3.2%) and Japan (2.0%) are the laggards, both still below their pre-covid averages (5.0% and 3.3% respectively). In those economies, the post-pandemic liquidity surge has not yet given way to a return to trend growth.
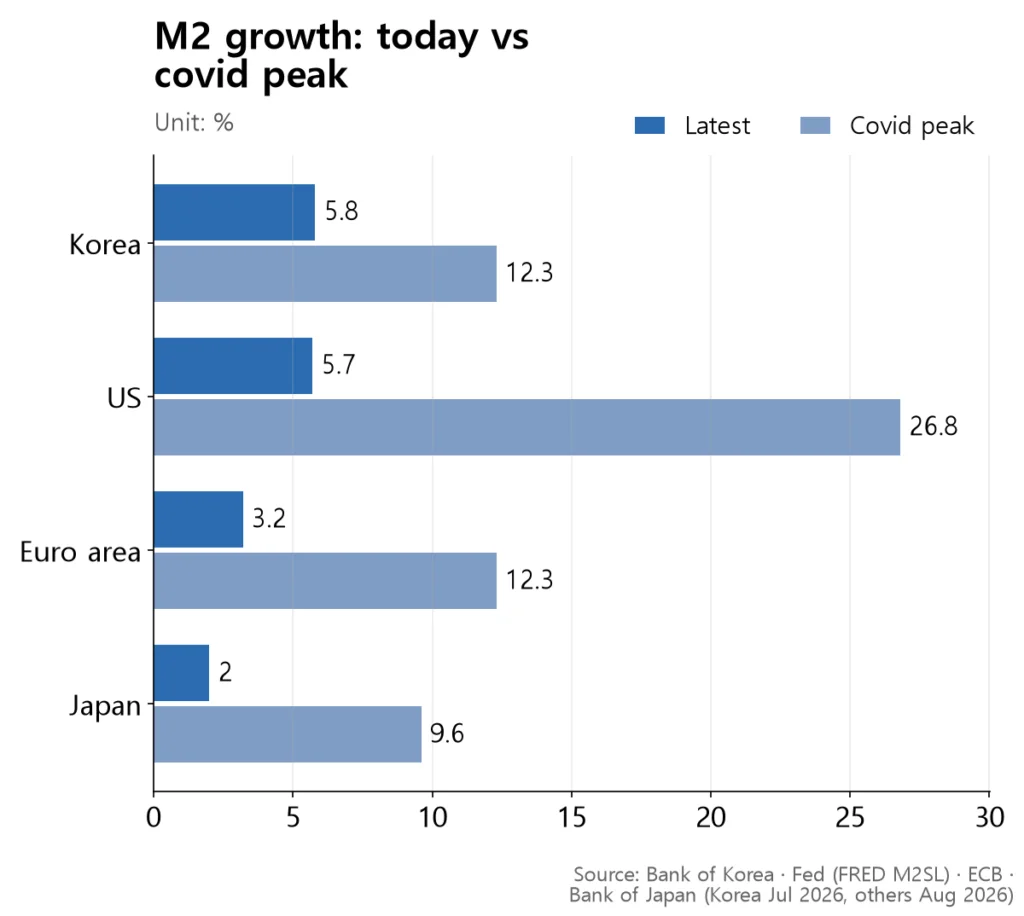
At the peak, the US stands out. M2 growth there hit 26.8% in February 2021 — more than twice the 12.3% peaks seen in Korea and the eurozone — a measure of how large the US fiscal and monetary response was in the early pandemic.
Six years on, is Korea back on its old path?

If growth is picking up again, the next question is: how far above ‘normal’ is the stock itself? The table below sets February 2020 (the eve of the pandemic) to 100 and compares the actual rise with a counterfactual: how much M2 would have grown had it continued at each country’s pre-covid five-year average rate.
| Country | Actual since Feb 2020 | At pre-covid pace | Gap |
|---|---|---|---|
| Korea | +52.3% | +54.5% | −1.4 pp |
| US | +50.7% | +41.0% | +6.8 pp |
| Euro area | +31.7% | +37.2% | −4.0 pp |
| Japan | +24.8% | +23.1% | +1.4 pp |
Korea’s actual +52.3% is almost indistinguishable from the +54.5% trend line. The pandemic surge has been offset by the subsequent slow years; six years on, the stock sits roughly where it would have been without the covid detour. The eurozone (−4.0 pp) is similarly on — or slightly below — trend. Only the US (+6.8 pp) has significantly more money in circulation than its old trajectory would imply.
These counterfactuals rest on the strong assumption that 2015–2019 growth rates would have continued unchanged, so the numbers should be taken as a benchmark, not a precise verdict. Still, they offer a rough answer to the common question of whether ‘too much money’ is sloshing around after the pandemic.
Why the ‘4,000 trillion won’ headlines from 2024 no longer match
Readers searching this topic will quickly hit a June 2024 story reporting that Korea’s M2 ‘first crossed 4,000 trillion won’ — a figure that clashes with today’s reading of 3,823 trillion won for the 2024 annual average. The reason is a statistical overhaul.
In December 2025, the Bank of Korea redefined its money and liquidity aggregates in line with the IMF’s 2017 Monetary and Financial Statistics Manual. Non-MMF investment-fund products (equity funds, bond funds, ETFs) were removed from M2; promissory notes and note-type CMA accounts issued by mega-sized investment banks were added. On the new definition, October 2025 M2 is 4,056.8 trillion won — 9.2% smaller than the 4,466.3 trillion won on the old series. The growth rate also dropped from 8.7% (old) to 5.2% (new).
So the old news figure of 4,013 trillion won for April 2024 referred to the old-definition seasonally adjusted stock. The current ECOS reading for the same month on the new definition is 3,808 trillion won. The two numbers measure different things and should not be spliced together.
How to read these numbers
- Faster M2 growth is not the same as faster inflation or house-price gains. The money supply moves with the size of the economy, interest rates and deposit shifts; this piece looks only at the pace of money, not its downstream effects.
- No cross-country comparison of stocks. Korea and Japan report period-average M2, the US and eurozone report end-of-period M2, and the exact components differ by country — so only year-on-year growth rates are compared here.
- The eurozone 3.2% is the ECB’s official figure, which includes reclassification adjustments. A simple stock-to-stock calculation would give 4.34%.
- Don’t mix old and new definitions. The BOK rebuilt the back series on the new basis, but any Korean news number published before December 2025 is almost certainly on the old definition.
- Monthly figures are preliminary and confirmed the following month; seasonally adjusted series are revised each January for the previous five years.
Summary
Money growth in South Korea is clearly picking up. Going from 1.2% in January 2024 to 6.0% in June 2026 — a fivefold rise in two and a half years — is not a small shift. But that pace is still half the covid peak of 12.3% and a touch below the pre-pandemic normal of 7.0%. On a cumulative basis, Korea’s M2 stock sits almost exactly where the pre-covid trend would have put it.
In other words, this looks less like a new surge and more like a return to trend after an emergency. Two things to keep in mind when reading future coverage: the US is accelerating alongside Korea, and the BOK’s end-2025 overhaul means older headlines use a different yardstick than today’s data.

Awesome News on Instagram @awesome_news_kr
This article is the research behind our Korean-language card news. Every morning we turn Korean data and official sources into short visual stories. See it on Instagram →
Sources
- Bank of Korea — Economic Statistics System (ECOS) 161Y006 M2 raw average balance and 161Y005 seasonally adjusted series (Korean) (accessed 2026-09-29)
- Bank of Korea — Monetary and Liquidity Aggregates, December 2025 (press release 2026-02-05) (Korean) (2026-02-13)
- Statistics Korea / Bank of Korea — e-나라지표 Indicator 1072: Money Supply (M2) (Korean)
- Federal Reserve Bank of St. Louis / FRED — M2SL: M2 Money Stock
- European Central Bank — BSI Statistics — Monetary aggregate M2 (euro area)
- Bank of Japan — Time-Series Data Search MD02 M2 (period average) (Japanese)
- Metro Seoul — Report on the Bank of Korea’s M2 statistics overhaul (Korean) (2025-12-30)
- JoongAng Ilbo — Money supply crosses 4,000 trillion won for the first time (Korean)
📊 Download the data
Every number in this article’s 5 charts and tables, in one CSV file (opens in Excel or Google Sheets). When you cite it, please name the original source and link to this page.
Download CSV