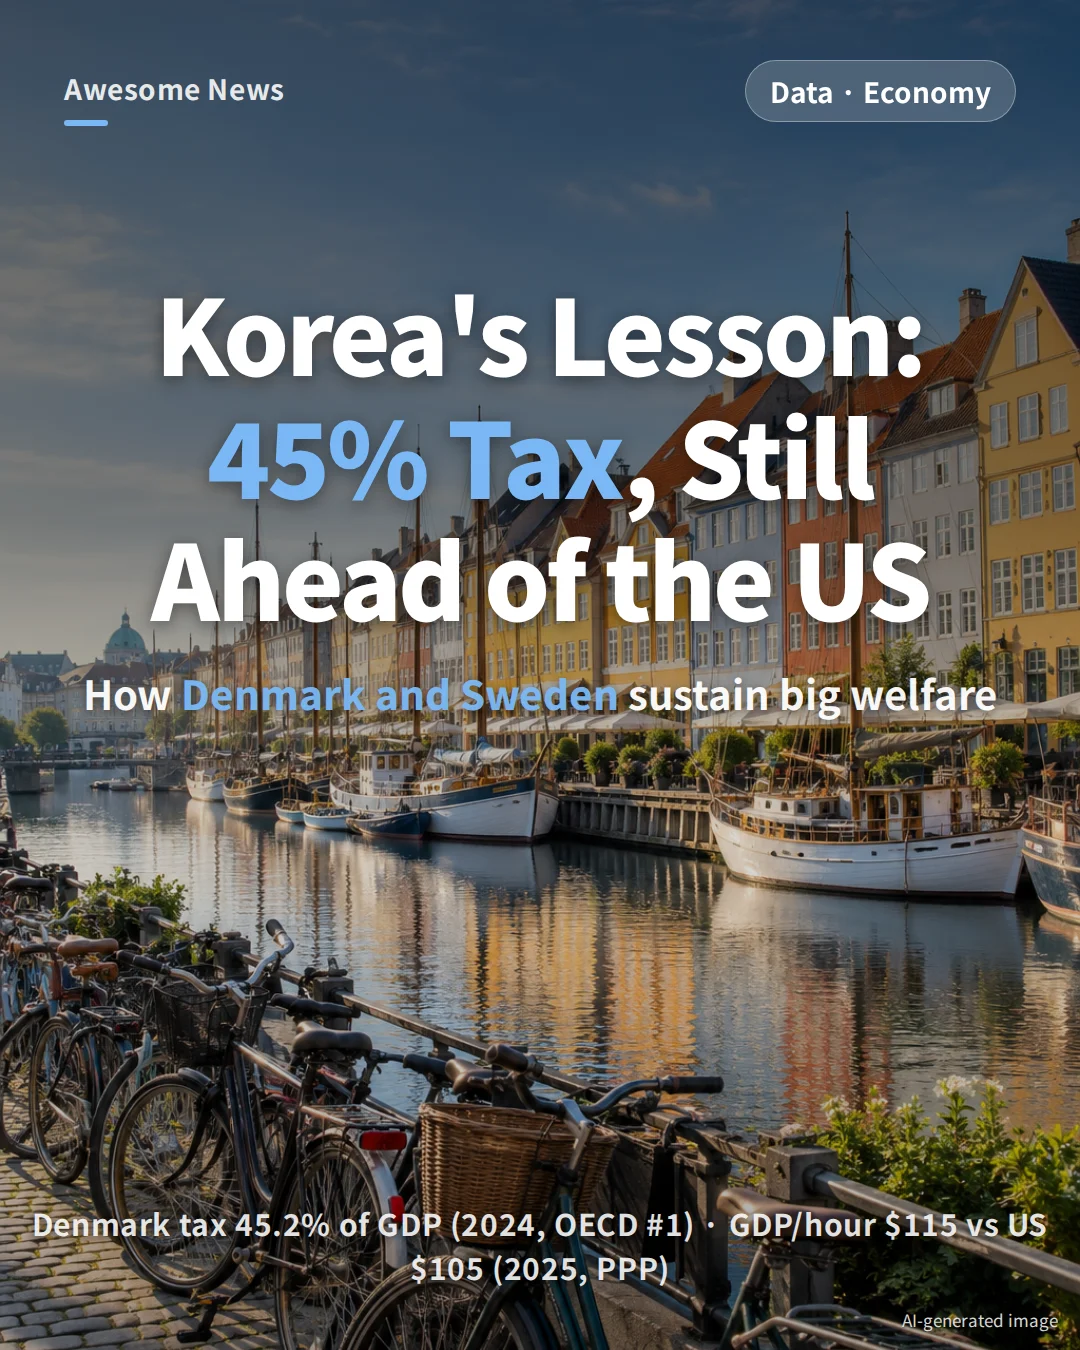
Denmark’s total tax take reached 45.2% of GDP in 2024, the highest in the OECD. Its output per hour worked was $115 in 2025 (PPP), above the United States at $105. How can a country with such a heavy tax load be more productive than one with a lighter one?
A previous post showed that most of the OECD’s 13 biggest welfare spenders have held or improved their IMD competitiveness ranks — Denmark and Sweden have stayed near the top for 20 years. This piece asks a narrower question: among heavy-welfare countries, why do these two stand out on growth, public finances and competitiveness? The answer, in the data, sits on three axes: debt, labor markets and taxes.
Key numbers at a glance
- Social spending is 26.4% of GDP in Denmark and 26.1% in Sweden — almost identical to the 27.2% average of the 11 other heavy-welfare countries.
- Yet real income per person grew +16.6% in Denmark and +11.9% in Sweden from 2007 to 2025 — two to three times the +4.9% average of the other 11.
- Government debt fell from 53.6% to 27.9% in Denmark and 50.4% to 35.1% in Sweden between 2000 and 2025. The other 10 climbed from 67.7% to 95.7%.
- Denmark spends 1.54% of GDP on active labor-market policies (job training, placement) — four times the OECD average (0.39%) and double its own jobless-benefit outlay (0.73%).
- The widest Korea–Denmark gap is not tax rates but institutions: on IMD 2026 Business Legislation, Denmark ranks 6th, Sweden 14th, Korea 53rd.
Same welfare spend, different results
Start with a myth. Denmark and Sweden do not do better than other European welfare states because they spend less on welfare. OECD SOCX puts their public social expenditure at 26.4% and 26.1% of GDP in 2024 — essentially the same as the 27.2% average of the 11 other top welfare spenders.
The outcomes diverge sharply. Real GDP per capita rose 16.6% in Denmark and 11.9% in Sweden between 2007 and 2025, against a 4.9% average for the other 11. On IMD’s World Competitiveness ranking (70 countries), Denmark came 6th and Sweden 9th in 2026; the best of the other 11 managed only 14th.
| Metric | Denmark | Sweden | Other 11 |
|---|---|---|---|
| Social spending (% of GDP, 2024) | 26.4% | 26.1% | avg 27.2% |
| Real GDP per capita growth (2007→2025) | +16.6% | +11.9% | avg +4.9% |
| IMD competitiveness rank (70 countries, 2026) | 6th | 9th | best is 14th |
So the size of the welfare state does not explain the gap. The next three sections look at what does.
Lesson 1 — They don’t borrow to pay for welfare

A welfare state only lasts if it is funded. Many European countries plugged the gap with sovereign bonds and watched their debt snowball. Denmark and Sweden went the other way.
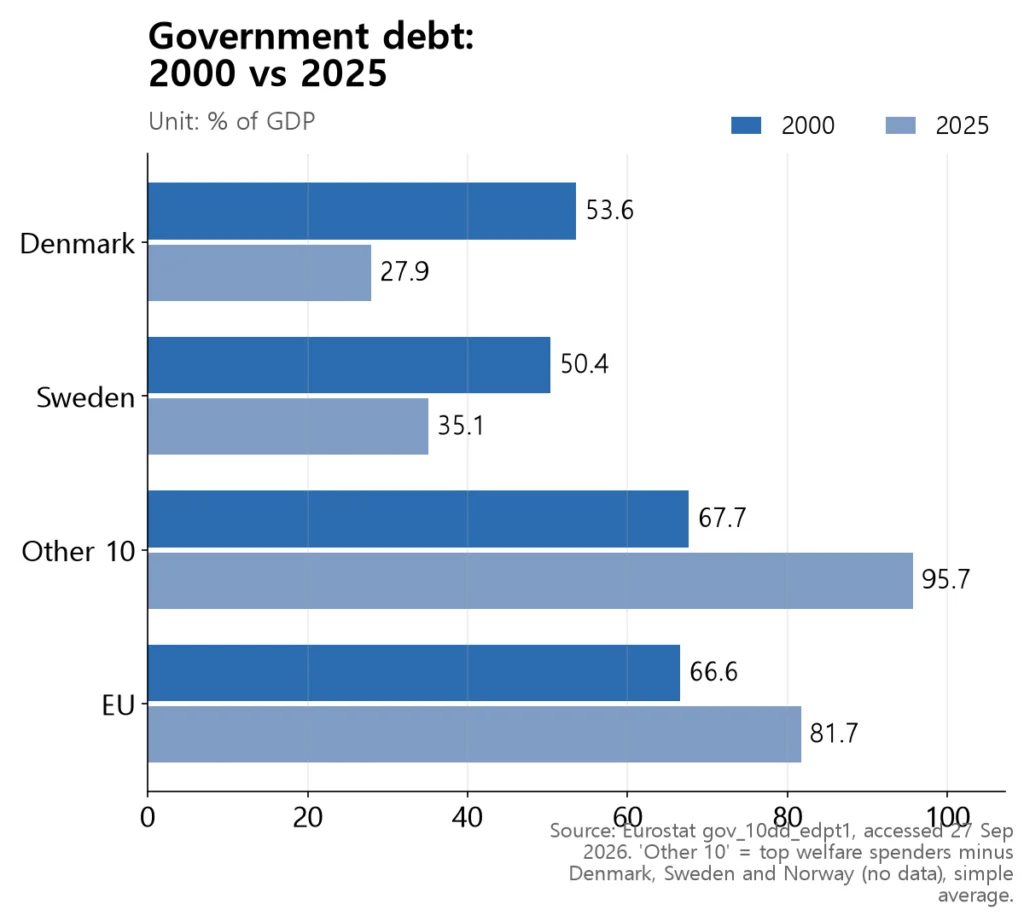
In 2000 Denmark (53.6%) and Sweden (50.4%) looked much like the EU average (66.6%) or the other welfare states’ 67.7%. Sweden had peaked at 69.3% of GDP in 1996. By 2025 the two had cut debt to 27.9% and 35.1% — roughly half their earlier levels. Over the same period the other 10 climbed to a 95.7% average, with France at 115.6% and Italy at 137.1%.
Two habits do the work. The first is paying down debt when the economy is good. Denmark took on debt in the 2010 downturn (46.1% of GDP) and has since brought it back to 27.9%. Borrow in a crisis, repay once it passes — a routine, not an exception.
The second is designing out future deficits. Denmark linked its state pension age to life expectancy in 2006 and, in May 2025, passed a law raising the retirement age to 70 by 2040 (81 for, 21 against). Sweden has run a ‘Notional Defined Contribution’ (NDC) pension system since 1999, in which payouts adjust automatically when the fund falls short. In both cases, today’s welfare is not quietly financed by tomorrow’s taxpayers.
Lesson 2 — Welfare that pushes people back into work

A welfare state also needs taxpayers. That means working-age people actually working — and getting back into work quickly after a layoff. This is why Danish ‘flexicurity’ is cited so often.
| Metric | Denmark | Sweden | OECD / EU |
|---|---|---|---|
| Active labor-market policy (% of GDP, 2024) | 1.54% | 0.88% | OECD avg 0.39% |
| Passive — unemployment benefits etc. (% of GDP, 2024) | 0.73% | 0.36% | OECD avg 0.57% |
| Employment rate, ages 20–64 (2025) | 79.8% | 81.8% | EU avg 76.1% |
The Danish model has three legs. Firing is relatively easy (OECD regular-contract protection index 1.94, below the OECD’s 2.21). Unemployment benefits are generous — up to 90% of the previous wage, though a cap makes it most generous for low earners. And retraining and job search are mandatory. Benefit duration was shortened in stages, from four years in 1999 to two years by 2010.
The spending mix is unusual. Denmark puts twice as much into getting people back to work (1.54%) as into unemployment cash (0.73%). Sweden’s ratio is similar (0.88% vs 0.36%). Across the OECD the balance is reversed (0.39% vs 0.57%). Far more goes into returning to work than into staying out of it.
Employment rates follow. For ages 20–64, Sweden is at 81.8% and Denmark at 79.8%, well above the EU’s 76.1% (France 75.4%, Italy 67.6%). Caveats: Sweden still has youth unemployment of 24.3%, far above the EU’s 15.2%, and flexicurity alone does not explain everything — Austria matches Denmark’s 1.94 employment-protection score with weaker results.
Lesson 3 — Taxes aren’t lower. They’re higher

A common guess is that Denmark thrives because it has cut corporate tax. The numbers point the other way. On total tax burden, Denmark is still among the heaviest-taxing countries in the world.
| Country | Tax burden (2024) | Corporate tax rate (2025) |
|---|---|---|
| Denmark | 45.2% (OECD #1) | 22% |
| Sweden | 41.4% | 20.6% |
| Other welfare states (avg) | 40.5% | 25.9% |
| OECD average | 34.1% | 24.2% |
| South Korea | 25.3% | 26.4% (27.5% in 2026) |
Taxes and social contributions together take 45.2% of GDP in Denmark and 41.4% in Sweden — heavier than the OECD average (34.1%) and heavier than the 40.5% average for other welfare states. South Korea’s 25.3% is almost half. The table’s point is not that low taxes power the Nordic model, but that high taxes have not killed it.
What about corporate tax? Denmark’s 22% and Sweden’s 20.6% are 3–5 points below the welfare-state average (25.9%) and the OECD mean (24.2%). But this is a weak explanation. Finland (20%), Norway (22%) and Greece (22%) are in the same range, and almost every OECD country has cut corporate tax since 2000 (simple OECD average: 32.3% in 2000 → 24.2% in 2025). The direction is universal; it does not single Denmark or Sweden out.
Where the real gap lies — institutions

So what really separates these two countries from other welfare states — and from South Korea? The detailed IMD 2026 sub-rankings start to answer that question.
| Sub-ranking (of 70) | Denmark | Sweden | South Korea | Other 11 median |
|---|---|---|---|---|
| Business legislation | 6th | 14th | 53rd | 36th |
| Institutional framework | 3rd | 4th | 21st | 26th |
| Management practices | 1st | 6th | 49th | 37th |
| Tax policy (lower rank = heavier tax) | 63rd | 64th | 22nd | 61st |
On tax policy alone, Denmark (63rd) and Sweden (64th) sit far below South Korea (22nd) — their taxes really are heavier. They nonetheless finish 6th and 9th overall because they dominate on business legislation, institutional framework and management practices: Denmark ranks 6/3/1, Sweden 14/4/6 on those three. The 11 other welfare states’ median is 36/26/37.
This is also where South Korea trails them most. Business legislation ranks 53rd and management practices 49th, both far below its 22nd for tax policy. Korea’s public social spending is still 15.3% of GDP — about 60% of the Danish or Swedish level (calculated: 15.3 ÷ 26.4 ≈ 0.58) — and rising. If that welfare expansion is to prove sustainable, the question these rankings raise is not the size of the tax base, but the quality of the institutions the money has to flow through.
How to read these numbers
- The ‘other 11’ and ‘other 10’ averages are simple means, not weighted by population or GDP.
- Sweden has unresolved problems. Youth unemployment of 24.3% (2025) is far above the EU’s 15.2%, and rent controls have produced long housing-queue waits.
- Not all Nordics look the same. Finland has government debt of 88.5% and unemployment of 9.7% — a very different track. ‘Nordic equals success’ is a shortcut, not a fact.
- Some policy timeline details (the year Sweden adopted its fiscal rule, the stages of Denmark’s benefit cuts) come from secondary sources rather than raw data.
- IMD rankings depend on how many countries are included (55 in 2006, 70 in 2026). Growth rates and absolute indicators — debt, employment, tax ratios — are steadier yardsticks.
Summary — welfare depends on ‘how,’ not ‘how much’
The Denmark–Sweden story condenses into three sentences. They fund welfare with taxes, not debt. They spend more on getting people back to work than on paying them to stay out. They tax heavily — but the institutions that spend the money are among the best in the world. The model holds up because the taxes work, not because they are small.
For South Korea, the lesson is less ‘how much more welfare?’ than ‘what else needs fixing alongside it?’ Public social spending has climbed to about 60% of the Nordic level, but the institutional gap — business legislation at 53rd, management practices at 49th — is much wider. A durable welfare state ultimately rests on two legs together: fiscal discipline and institutional quality.

Awesome News on Instagram @awesome_news_kr
This article is the research behind our Korean-language card news. Every morning we turn Korean data and official sources into short visual stories. See it on Instagram →
Sources
- IMD — World Competitiveness Yearbook 2026 (booklet) (2026)
- Eurostat — Government debt (gov_10dd_edpt1) (accessed 27 Sep 2026)
- Eurostat — Employment rate 20–64 (lfsi_emp_a); Unemployment rate (une_rt_a) (accessed 27 Sep 2026)
- OECD — Labour Market Programmes (DSD_LMP); Employment Protection (DSD_EPL) (2024–2025)
- OECD — Social Expenditure Database (SOCX, DSD_SOCX_AGG) (2024 provisional)
- OECD — Revenue Statistics (DSD_REV_COMP_OECD); Corporate Income Tax (DSD_CIT) (2024–2025)
- OECD — Productivity Database (DSD_PDB) — GDP per hour and per capita, PPP (2025)
- Norman & McLure, NBER — The Swedish Tax Reform of 1991 (NBER c6521)
- Andersen & Svarer, Aarhus University — Flexicurity — Labour Market Performance in Denmark (wp07_09)
📊 Download the data
Every number in this article’s 5 charts and tables, in one CSV file (opens in Excel or Google Sheets). When you cite it, please name the original source and link to this page.
Download CSV