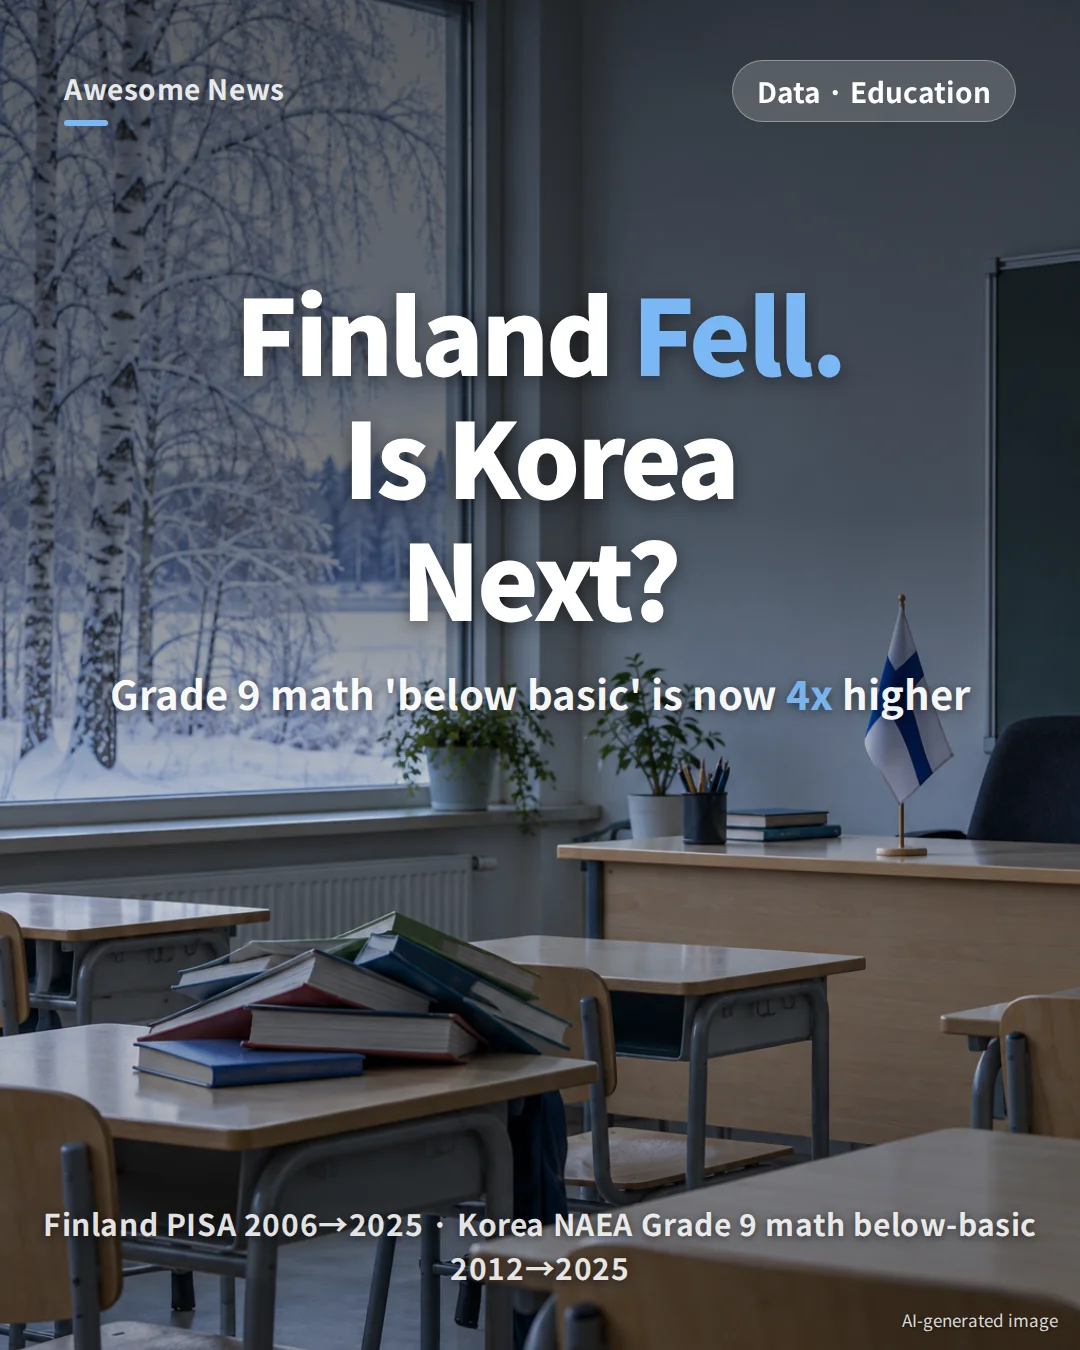
Finland, long sold as the world’s model school system, is sliding. In the PISA 2025 results released by the OECD on September 8, 2026, Finland’s average across reading, math and science fell to 482.3, more than 70 points below its 2006 peak of 552.7. Its lead over the OECD average narrowed from 53 points to 9. South Korea’s three-subject average has held near the top, but a separate domestic test shows the share of ninth-graders missing the basic bar in math has roughly quadrupled since 2012. (PISA is a test the OECD gives 15-year-olds every three years in reading, math and science.)
Key numbers at a glance
- Finland’s PISA three-subject average: 552.7 → 482.3 (2006→2025). Lead over the OECD average: +52.9 → +8.6.
- Across about 5,000 Finnish 15-year-olds, more student-led lessons correlated with lower math scores (Saarinen et al., 2020).
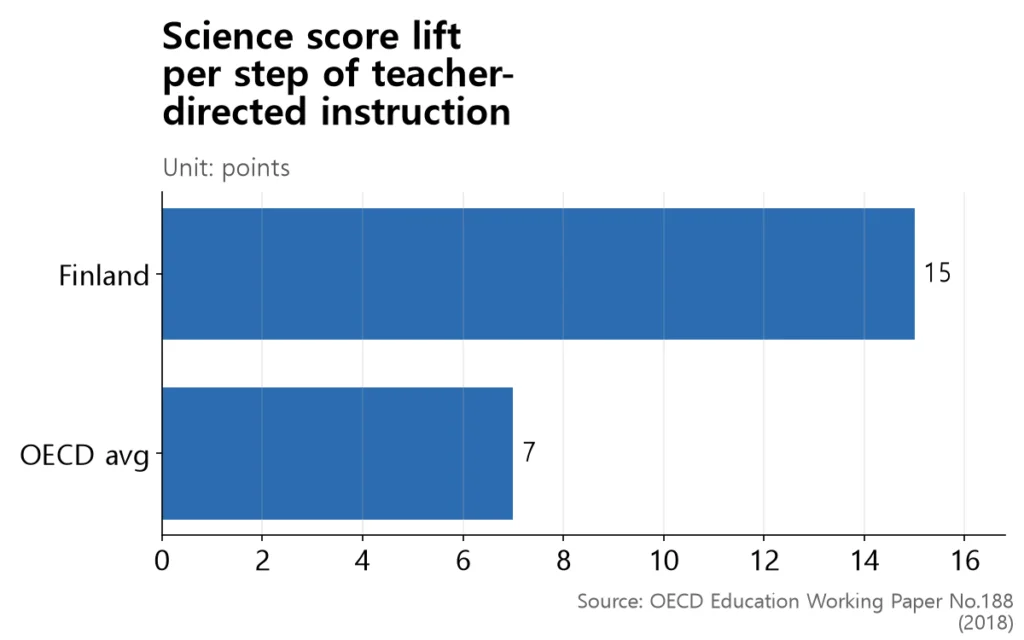
- OECD analysis: one extra step of teacher-directed science teaching lifts scores +15 points in Finland, +7 across the OECD (Working Paper No.188).
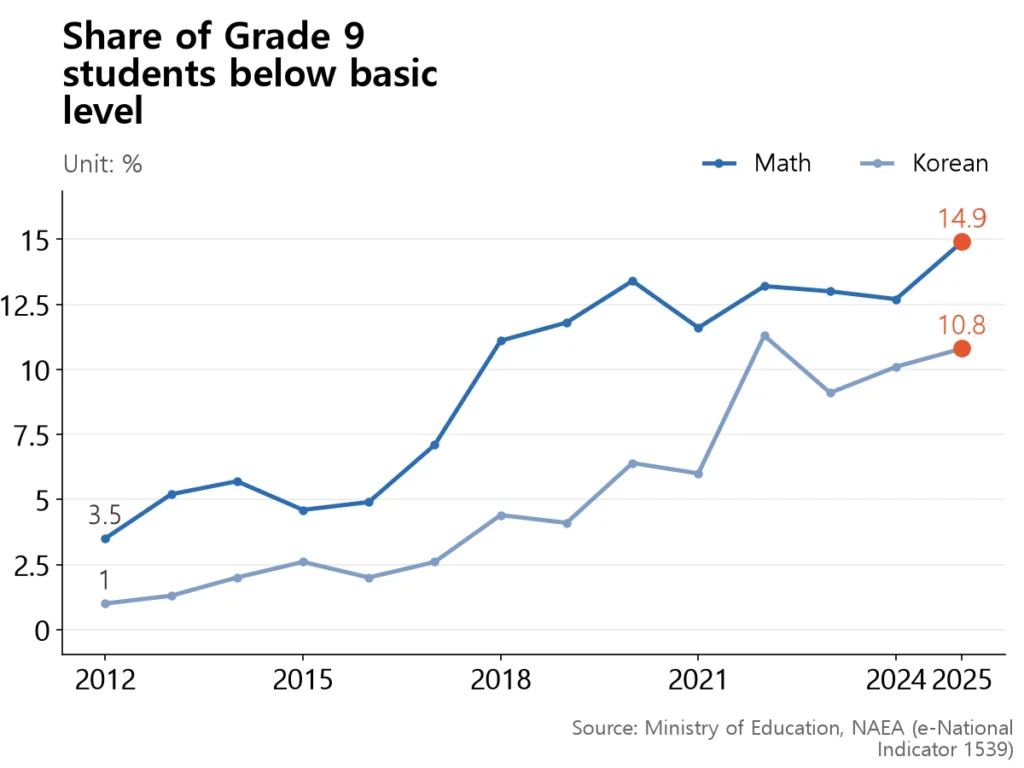
- South Korea Grade 9 students missing the basic math bar: 3.5% → 14.9% (2012→2025, about 4x). Korean language: 1.0% → 10.8%.
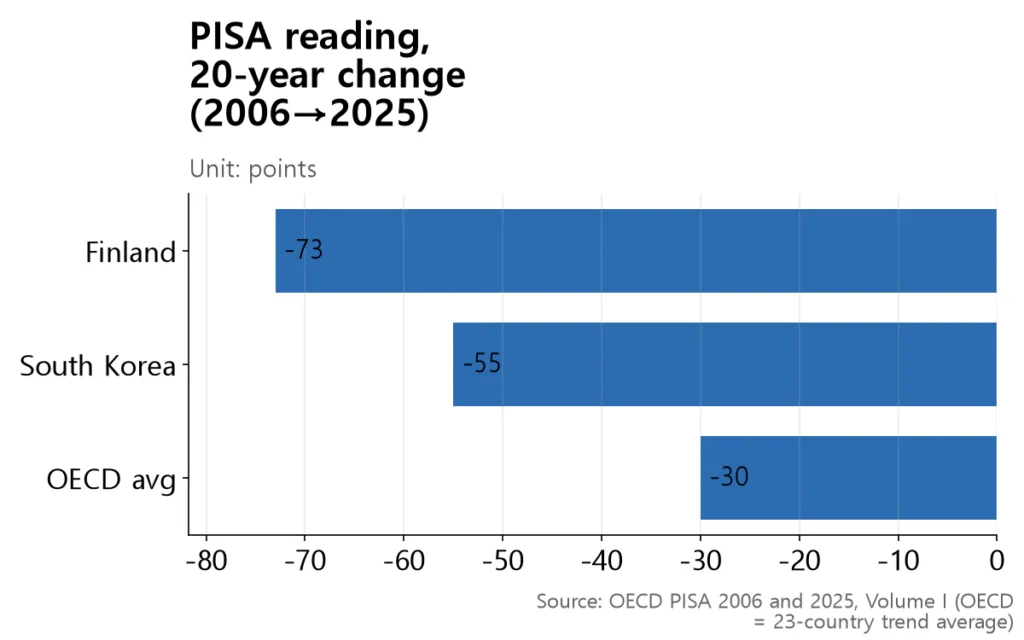
- South Korea’s PISA reading score fell 55 points over 20 years, close to Finland’s 73-point drop.
- From August 2025, Finland banned phones in class and added hours of first-language and math teaching.
Finland: two decades downhill

Finland topped the first PISA reading table in 2000, cementing its reputation. By 2006 its three-subject average stood at 552.7, roughly 53 points above the OECD mean of 499.8. Every round since has edged lower: 495.0 in 2022, 482.3 in 2025 — a 70.4-point drop over 20 years (calculated).
South Korea has held in the 519-point range and is still a top performer, but the shape of the two curves differs. Korea peaked at 542.7 in 2012, dropped sharply to 519.0 in 2015 and has been roughly flat since, while Finland has slid steadily. Note that PISA switched from paper to computer-based testing in 2015, which complicates Korea’s 2012→2015 fall.
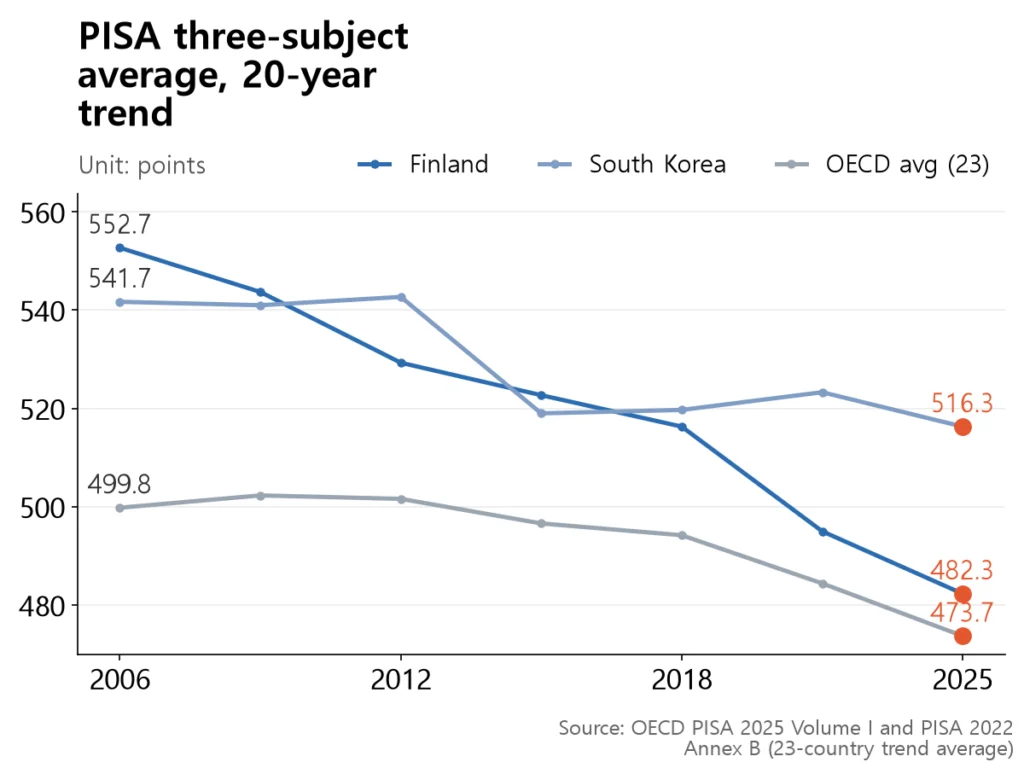
The gap to the OECD mean has narrowed as well. Finland’s +52.9-point edge in 2006 has shrunk to +8.6 points in 2025 (calculated). It is now barely above average. South Korea moved the other way: its lead widened from +22.4 in 2015 to +42.6 in 2025 (calculated). On the headline number, Korea still has room.
Why? The spotlight falls on student-led teaching

The most-cited explanation comes from a University of Helsinki team (Saarinen et al., 2020). Using PISA 2012 data on about 5,000 Finnish 15-year-olds, they found that the more lessons were built around student projects and group work, the lower math scores tended to be. The link was stronger for students from low-income, immigrant or single-parent households, and for those with high absence rates.
The OECD reached a similar pattern. OECD Education Working Paper No.188 (2018), using PISA 2015, found that moving one step up on ‘teacher-directed’ science instruction (where the teacher explains until students understand) raised science scores by +15 points in Finland versus +7 on OECD average. Inquiry-based lessons, where students run their own experiments, were negatively associated with scores in most countries.
Why ‘because of’ is the wrong word
Both studies measure correlations at a single point in time. They do not show that student-led teaching caused scores to fall. The Saarinen team was explicit: no causal or temporal conclusion can be drawn. Reverse causation is also plausible — weaker students may simply be given more individual and project work.
The timing is awkward too. Finland’s new national curriculum, built around ‘phenomenon-based learning,’ took effect in August 2016, but the slide began in 2006. More than half of the drop in science and math had already happened in cohorts that never experienced the new curriculum. Finland’s own PISA 2025 country report concludes that there is no single cause and that the drivers lie in broader social change, not just schools. Reading has declined (63% of Finnish boys say they read only when they have to), smartphones have spread, attitudes toward school have shifted, and the OECD as a whole is drifting down.
South Korea: the average holds, the floor is cracking
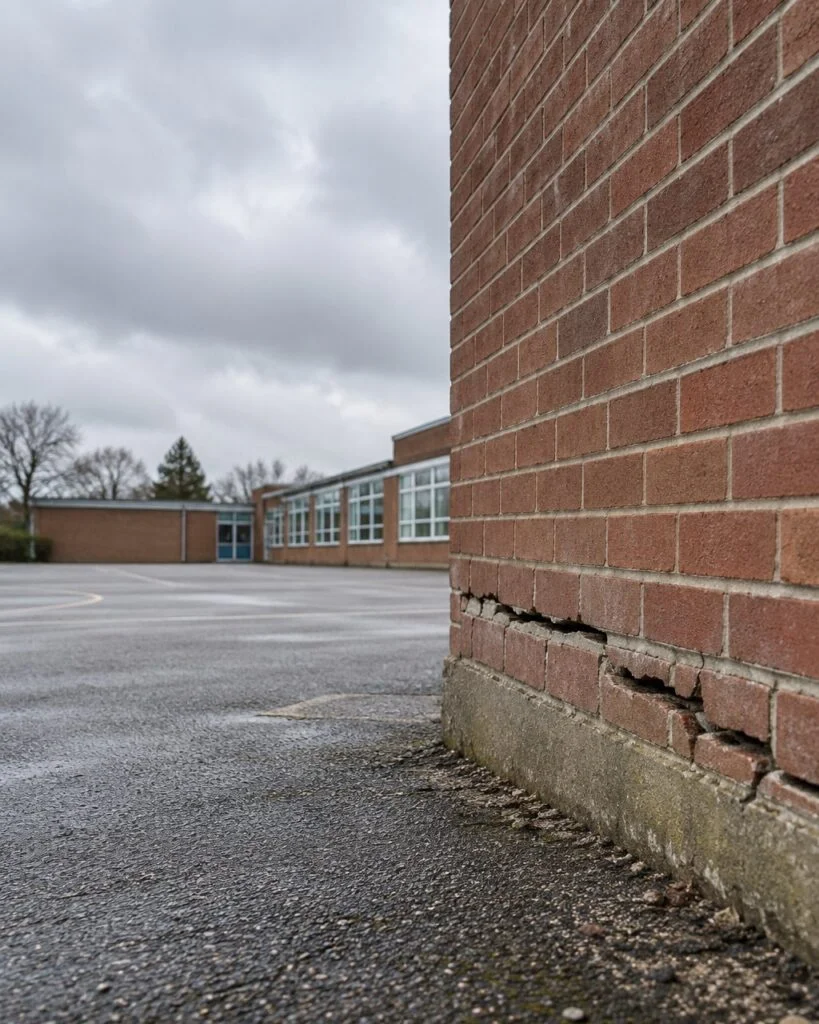
South Korea’s PISA average is still among the world’s best. But the National Assessment of Educational Achievement (NAEA), the country’s own annual test, is sending a different signal. The ‘below basic’ category covers students who have not reached the minimum level (Level 1) expected for their grade.
Among ninth-graders, the share scoring below basic in math rose from 3.5% in 2012 to 14.9% in 2025 — roughly four times higher. Korean-language ‘below basic’ jumped from 1.0% to 10.8%, and for Grade 11 Korean from 2.1% to 10.4%. The 2025 Grade 9 math figure is the highest since the test moved to a sampled design.
PISA reading tells a similar story. South Korea’s reading score dropped from 556 in 2006 to 501 in 2025 — a loss of 55 points in 20 years. That is less than Finland’s -73, but nearly double the OECD-23 average’s -30. Korea’s real profile is a high average with a cracking floor.
Why ‘4x’ is not quite the whole story
Three breaks in the series complicate year-to-year comparisons. First, in 2017 the NAEA switched from a universal test to a roughly 3% sample. Results no longer counted toward student or school records, which may have cut the incentive to try. Second, 2020 brought COVID-era remote learning. Third, in 2022 the paper test was replaced by a computer-based one (CBT). No study has yet isolated the sampling-switch effect, so the headline ‘4x rise in below basic’ still mixes real learning loss with changes in how the test was given.
Similar signals, different context
South Korea too has leaned toward ‘student-centered’ teaching over the past decade. The Free Semester program was piloted in 2013 and rolled out nationwide in 2016, with a one-year Free Year variant following in 2018. The 2015 and 2022 national curriculum revisions pointed in the same direction — more activities, less drill — much like Finland.
But the two cases are not interchangeable. No causal study has pinned a score drop on Free Semester; difference-in-differences and fixed-effects work by Korean researchers has found ‘no effect to small positive effect.’ What Park Yoon-soo of the Korea Development Institute (2017) did find was a widening gap: after Free Semester was introduced, participation in private tutoring among high-income families rose by 15.2 percentage points and their annual spending went up by 1.79 million won. Korea’s main risk may be less about the average and more about the gap.
Classrooms also differ. In international comparisons (OECD 2015), Korea actually uses less inquiry-based teaching than most countries — on paper the shift to ‘free lessons’ may not have reached classrooms as deeply as the slogan suggests. And Korea’s dense private tutoring market, with a 75.7% participation rate in 2025, can mask the effect of changes in school teaching on headline scores.
Finland’s prescription
Finland has stopped short of blaming any single cause but is moving on the classroom front. From August 1, 2025, an amendment to the Basic Education Act banned phone use during lessons as a general rule, and extra teaching time was added for first-language in the early grades and math in grades 3–6. Both changes came after the PISA 2025 test, so their effect is not yet visible.
South Korea is also tilting back toward basics. In 2019, basic-skills screening was made mandatory from Grade 1 to the first year of high school. From 2022, a schools-can-opt-in diagnostic was expanded. In 2025, the one-year Free Year was cut back to a one-semester Free Semester, and the new high-school credit system now includes required ‘minimum achievement guarantee’ instruction in Korean, English and math.
How to read these numbers
- PISA does not publish an official overall ranking. The ’17th place’ being cited for Finland is based on the three-subject average. By the same calculation, South Korea is 6th in 2025.
- The link between student-led teaching and lower scores is a correlation. No in-Finland study has shown causation, and reverse causation (weaker students getting more activity-based lessons) is possible.
- Finland’s decline began in 2006, a decade before the 2016 curriculum reform. A single reform cannot explain the whole trend.
- South Korea’s ‘below basic’ series was shaped by three breaks — a 2017 switch to sample testing, COVID in 2020 and the 2022 move to computer-based testing. Comparing 2012 and 2025 without caveats is tricky.
- The OECD’s official 2025 averages (science 482, reading 461, math 463) differ from the 23-country trend averages (485.9 · 465.8 · 469.4) used here. They should not be plotted together.
Summary
Finland’s 20-year slide cannot be reduced to ‘too much freedom in the classroom.’ The correlations exist, but reading has declined, phones have arrived and the OECD as a whole is drifting down. South Korea still ranks near the top on PISA averages, yet the jump in ‘below basic’ and the 55-point drop in reading are hard to dismiss. If Finland offers one lesson, it is that ‘student-centered’ and ‘solid basics’ need not be opposites. The number that belongs next to every PISA average is the share of children whose foundations are cracking — and the past 20 years in both countries show it.

Awesome News on Instagram @awesome_news_kr
This article is the research behind our Korean-language card news. Every morning we turn Korean data and official sources into short visual stories. See it on Instagram →
Sources
- OECD — PISA 2025 Results (Volume I) (2026-09-08)
- OECD — PISA 2022 Results (Volume I) — Annex B trend tables (2023-12)
- OECD — PISA 2025 Country Note — Finland
- OECD — PISA 2025 Country Note — Korea
- OECD — The Science of Teaching Science (Education Working Paper No.188) (2018)
- Saarinen et al., Electronic Journal of Research in Educational Psychology 18(51) — Student-oriented teaching practices and mathematics achievement in Finland (PISA 2012) (2020)
- Ministry of Education, Korea · e-National Indicator — Share of students below basic level, National Assessment of Educational Achievement (Indicator 1539) (Korean)
- Korea Development Institute (KDI), Park Yoon-soo — Effects and Development of the Free Semester Program (Policy Study 2017-13) (Korean) (2017)
- Korea Policy Briefing (Ministry of Education · Statistics Korea) — 2025 Survey of Private Education Spending for Elementary, Middle and High School (Korean) (2026-03-12)
- Helsinki Times — Finland’s PISA scores fall again in reading and maths
📊 Download the data
Every number in this article’s 4 charts and tables, in one CSV file (opens in Excel or Google Sheets). When you cite it, please name the original source and link to this page.
Download CSV