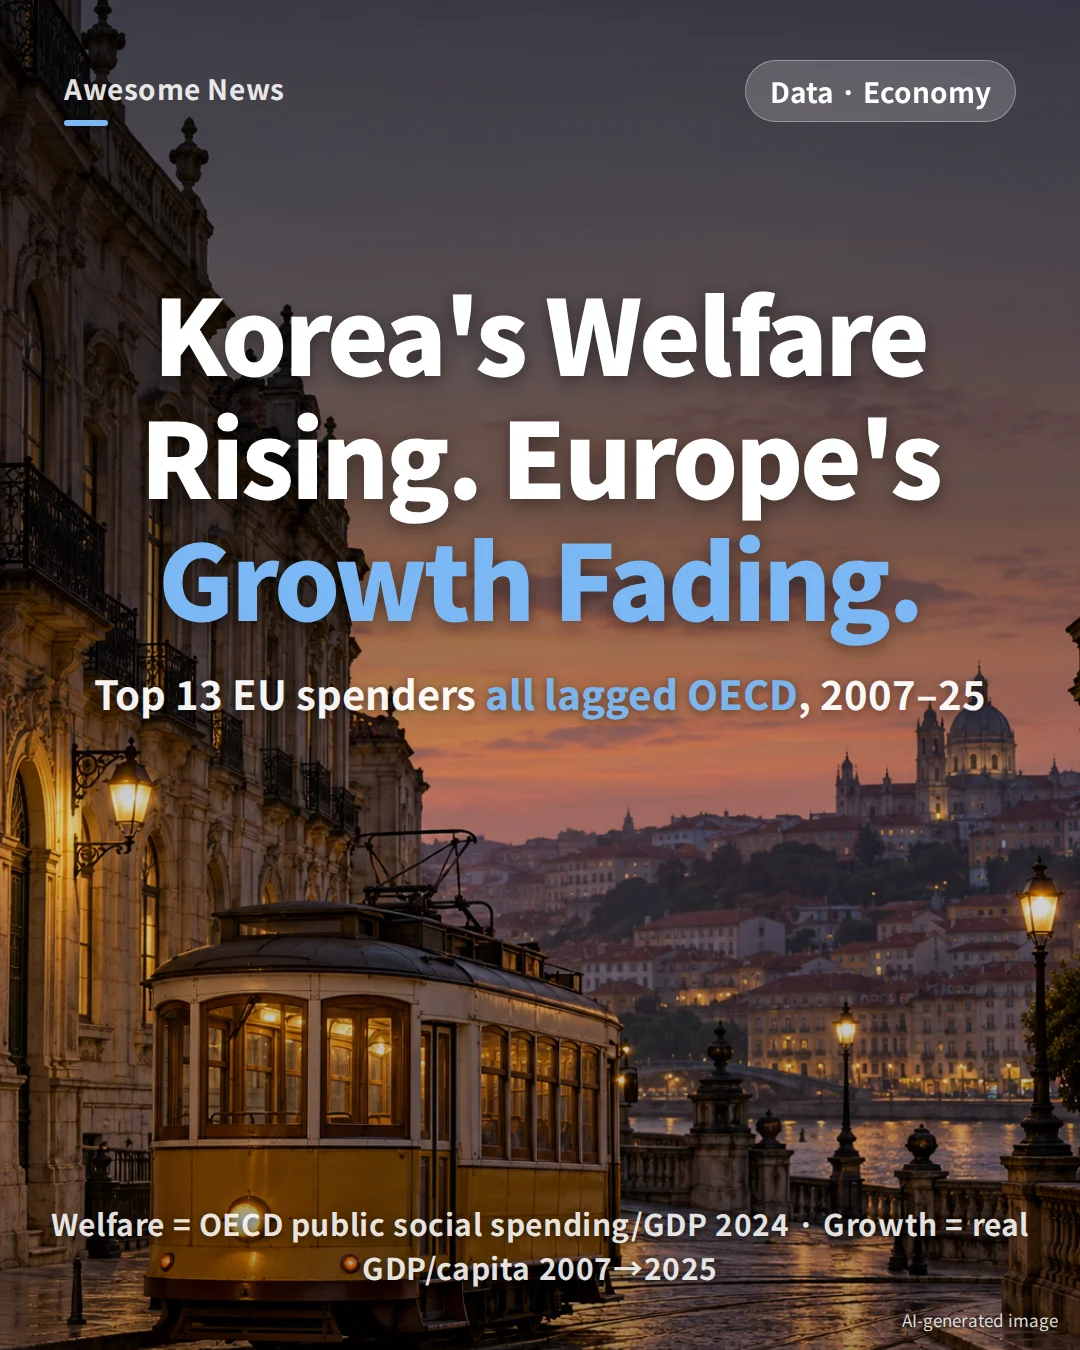
Among the 24 OECD countries with 2024 public social spending data, the top 13 by welfare share are all European — and every one of them grew real per-capita GDP more slowly than the OECD average between 2007 and 2025. South Korea, which more than tripled its own welfare share over 25 years, still grew 2.6 times faster than the OECD mean.
Key numbers at a glance
- All 13 top welfare spenders grew real per-capita GDP more slowly than the OECD average (+20.3%) and the United States (+25.6%) from 2007 to 2025.
- Even the fastest of the 13, Denmark, grew only +16.6%. Finland, Luxembourg and Greece shrank (−1.7%, −8.0%, −9.6%).
- Nearly identical welfare shares, very different outcomes: Portugal 24.1% / +14.4% vs Luxembourg 24.0% / −8.0%.
- South Korea’s welfare share rose from 4.2% in 2000 to 15.3% in 2024 — a 3.6× increase in 25 years, reaching 72% of the OECD average (21.2%).
- Yet Korea’s per-capita GDP grew +53.7% over the same window — 2.6× the OECD average.
Why the question matters now
Europe’s news cycle in the spring and summer of 2026 has turned on one question: can the welfare state still pay for itself? France’s public debt is projected to climb from 115.7% of GDP in 2025 to 119.3% in 2026, after Paris missed its 5% deficit target (actual: 5.4%) and tabled €54 billion in savings. In Germany, the Merz government has paired a 34-item reform package with a plan to cut €38.3 billion in welfare by 2030.
That raises an empirical question that opinion columns rarely answer: have the countries that spend the most on welfare actually grown faster, or slower? This article pairs OECD public social spending (SOCX) with OECD Productivity Database real per-capita GDP at constant purchasing power parity to find out.
18 years of growth: none of the 13 beat the average
The chart below tracks real per-capita GDP (constant PPP) from 2007, just before the global financial crisis, through 2025. The measure strips out prices and exchange rates to show the change in actual income per person.
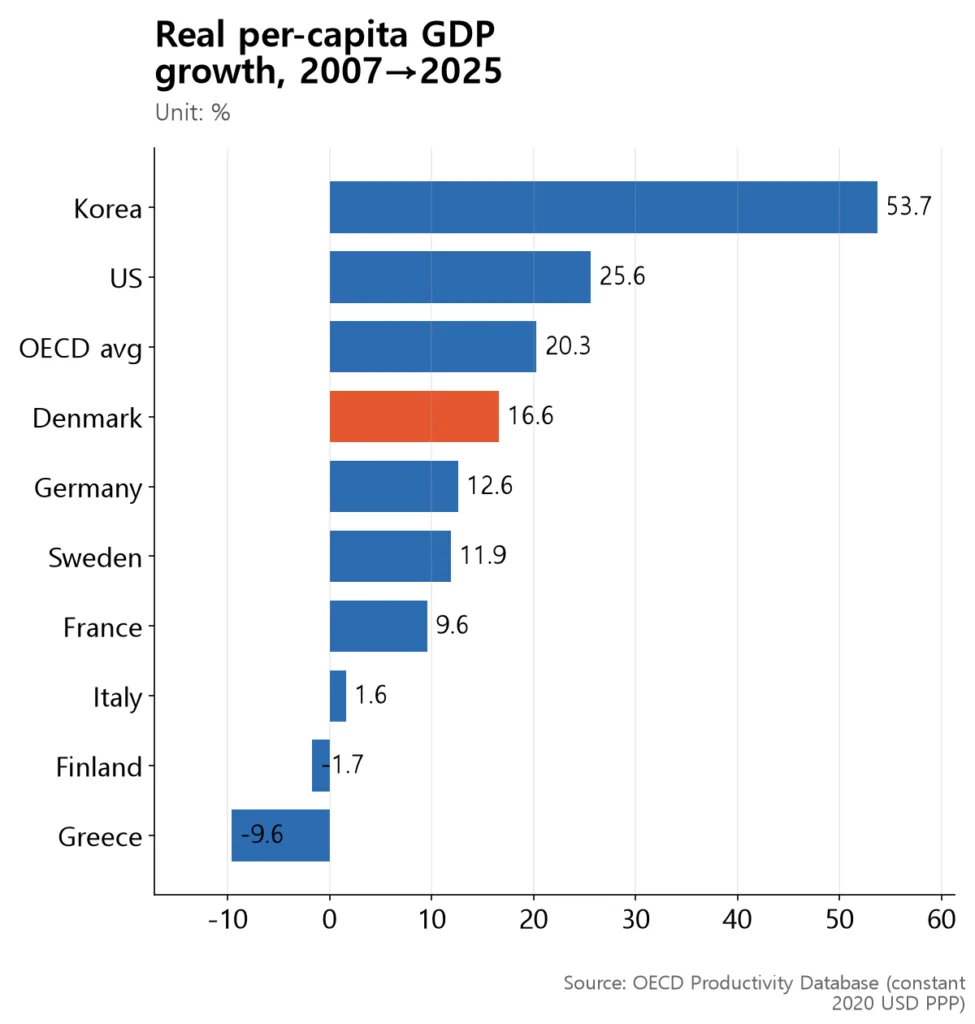
The best performer among the 13 welfare leaders, Denmark, managed +16.6% — still below the OECD average (+20.3%) and the US (+25.6%). The gap looks even larger next to South Korea’s +53.7% over the same 18 years.
The six welfare leaders not shown in the chart fit the same pattern: Portugal +14.4%, Belgium +11.8%, Spain +9.0%, Norway +8.6%, Austria +6.1% and Luxembourg −8.0%. All 13 came in below the OECD average, and Finland, Luxembourg and Greece are poorer per person today than in 2007. The simple average of the 13 is +6.4% (calculated) — about a third of the OECD mean.
Same welfare share, very different outcomes
Does bigger welfare automatically slow growth? The numbers say no. Countries with almost identical welfare shares can be more than 22 percentage points apart on growth.
| Country | Welfare share (2024) | Per-capita growth (2007→2025) |
|---|---|---|
| Portugal | 24.1% | +14.4% |
| Luxembourg | 24.0% | −8.0% |
| Denmark | 26.4% | +16.6% |
| Finland | 31.4% | −1.7% |
Portugal and Luxembourg spend about 24% of GDP on welfare but grew +14.4% and −8.0% respectively. Denmark spends more (26.4%) and still led the group on growth. Finland spends the most in the table (31.4%) and is slightly poorer per person than in 2007. The simple story — “more welfare, slower growth” — does not fit.
The academic debate is just as split. One camp (Bergh & Henrekson 2011) argues that a 10-percentage-point rise in government size lowers annual growth by 0.5 to 1 point. Another (Lindert 2004; Kleven 2014) finds that well-designed Nordic tax-and-transfer systems can combine high welfare with solid growth. This dataset cannot settle the debate; it only shows that welfare size alone does not predict the outcome.
South Korea’s welfare: 3.6× bigger in 25 years

Where does South Korea sit on this map? Public social spending went from 4.2% of GDP in 2000 to 15.3% in 2024 — a 3.6× increase (calculated) in a quarter-century. That is already 72% (calculated) of the OECD average of 21.2%.
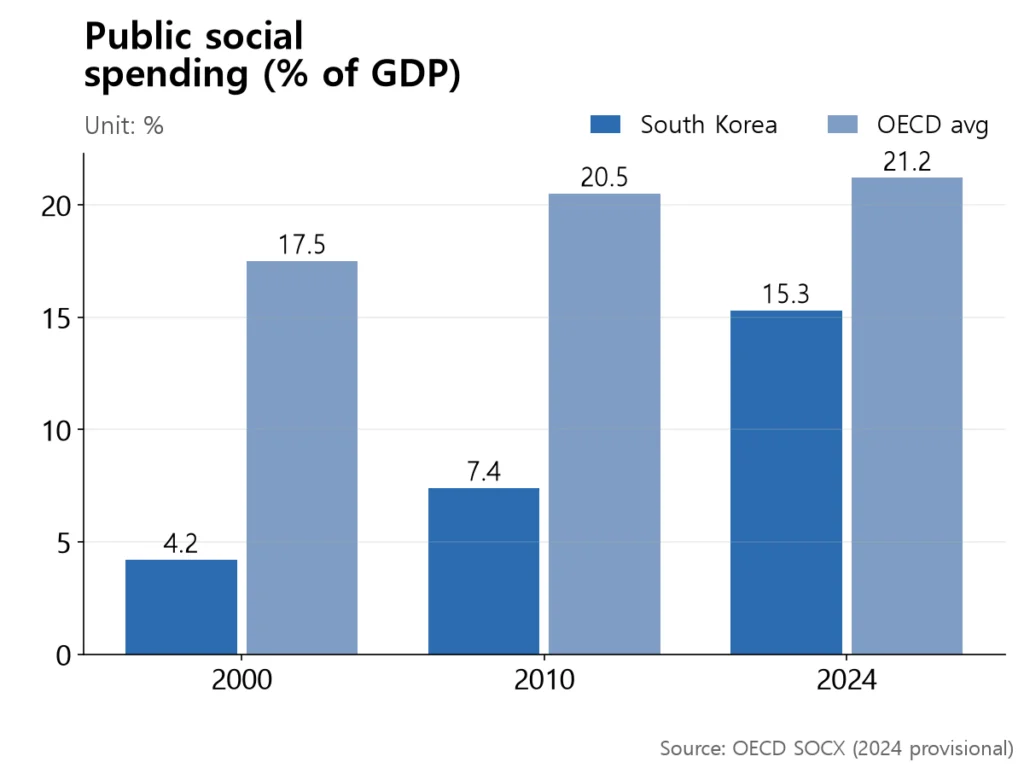
Compared with Denmark (26.4%) and Sweden (26.1%), Korea is still at about 0.6× (calculated). But the gap is closing quickly: in 2000 Korea’s welfare share was less than a quarter of the OECD average; it is now closer to three-quarters.
And growth? Korea’s real per-capita GDP climbed +53.7% between 2007 and 2025 — 2.6× the OECD average of 20.3% (calculated). That puts the country in an unusual position: a welfare system that is converging on Europe’s, with growth rates still closer to those of an emerging economy.
What South Korea has to decide — three numbers side by side

Put the three indicators in one table and Korea’s position becomes clear.
| Indicator | OECD avg | Top 13 welfare avg | South Korea |
|---|---|---|---|
| Welfare share (2024) | 21.2% | 27.1% | 15.3% |
| Per-capita growth (2007→2025) | +20.3% | +6.4% | +53.7% |
Korea’s welfare share sits below the OECD average and 11.8 points (calculated) below the top-13 mean. On growth it is more than eight times the top-13 average. With the population aging rapidly, further increases in welfare spending are effectively set. The remaining choice is less about how much to spend than how to spend it.
That is why the −8% to +16% spread inside the top 13 matters. Countries spending roughly the same share of GDP ended up far apart. A follow-up piece will zoom in on Denmark and Sweden, two cases where high welfare has so far coexisted with respectable productivity.
How to read these numbers
- “Top 13 = all European” is an artifact of the sample. Only 24 countries have 2024 SOCX values. Ranking those excludes Japan (24.7% in 2022), New Zealand and the United Kingdom, leaving a top 13 entirely in Europe.
- The dataset cannot explain the −1.7% or −9.6% losses. Finland’s Nokia collapse, Greece’s debt crisis, Italy’s industrial structure — those are separate stories. Nothing here proves welfare caused the slow growth.
- 2024 social-spending figures are provisional. For confirmed numbers, use the 2022 vintage (France 31.4%, Germany 27.7%, Denmark 25.5%, Sweden 25.3%).
- IMD competitiveness rankings tell a different story but for a reason. The IMD universe grew from 55 countries in 2007 to 70 in 2026, adding the UAE, Qatar and others at the top. European slippage in rank numbers is partly a sample effect — one reason this piece uses growth rates instead.
- A Nordic counterexample. Denmark’s hourly labor productivity reached $115 in 2025, above the US at $105. Being a welfare leader does not mean being exhausted.
Summary
The 13 European countries that spend more than a quarter of GDP on welfare all underperformed the OECD growth average over the past 18 years. But outcomes within the group ranged from −8% to +16%, so no single indicator — welfare size included — can explain the result. South Korea has tripled its welfare share in a quarter-century and still grown more than twice as fast as the OECD mean. The next question is not how much more to spend, but how to design it.

Awesome News on Instagram @awesome_news_kr
This article is the research behind our Korean-language card news. Every morning we turn Korean data and official sources into short visual stories. See it on Instagram →
Sources
- OECD — Public social spending database (SOCX, DSD_SOCX_AGG@DF_SOCX_AGG) (2024)
- OECD — Productivity Database (real per-capita GDP, constant USD PPP) (2025)
- IMD — World Competitiveness Yearbook 2026 (2026)
- Global Economic — France’s debt ratio projected to hit 119.3% this year; Franco-German yield gap widest since the euro crisis (Korean) (2026-09-20)
- Brussels Signal — Germany slashes welfare state to fund rearmament (2026-04-28)
- Centre for Eastern Studies (OSW) — Waiting for reforms: the future of the German welfare state (2026-06-15)
- Bergh & Henrekson, Journal of Economic Surveys 25(5) — Government Size and Growth: A Survey and Interpretation of the Evidence (2011)
- Kleven, Journal of Economic Perspectives 28(4) — How Can Scandinavians Tax So Much? (2014)
📊 Download the data
Every number in this article’s 4 charts and tables, in one CSV file (opens in Excel or Google Sheets). When you cite it, please name the original source and link to this page.
Download CSV